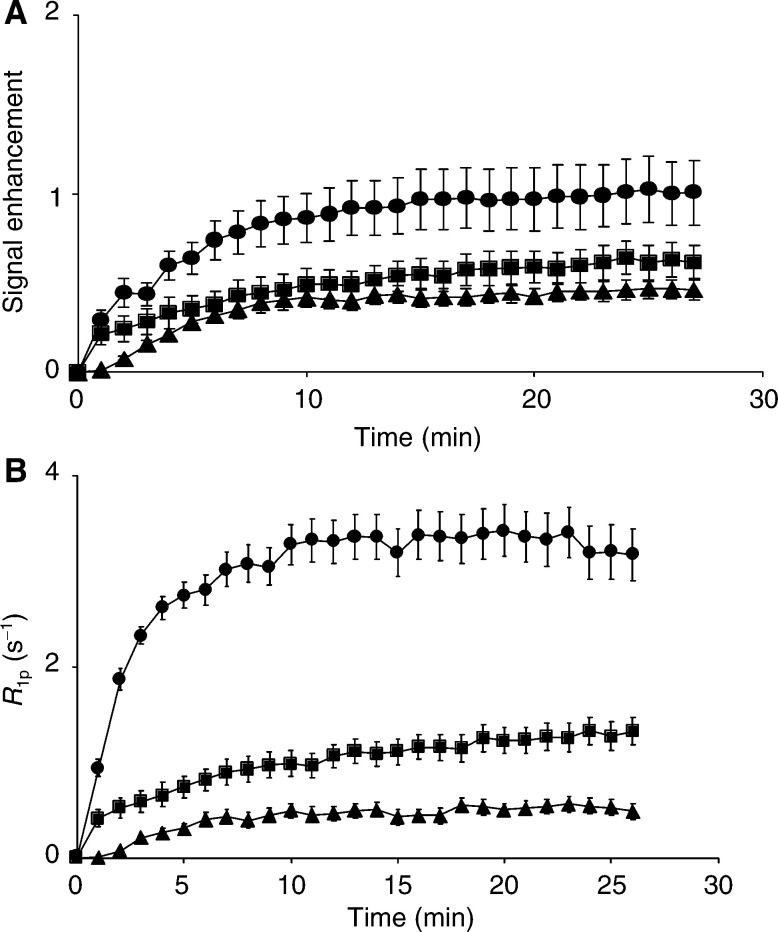
Figure 4.
Time-dependent changes in signal enhancement (A) and R1p values (B) in dynamic contrast agent-enhanced T1-weighted images obtained from EL-4 (▴), progressive E.G7-OVA (▪) and regressive E.G7-OVA (•) tumours. R1p, the paramagnetic contribution to the relaxation rate, is equivalent to the contrast agent concentration. The symbols represent the mean±s.e.m. (n=5). The numbers for signal enhancement were obtained from the entire tumour cross-section. However, because of difficulties in estimating R1p values in the relatively poorly perfused regions in the centres of some tumours, these were calculated for a 20 pixel-wide band in the tumour peripheries, where vessel density was higher.

