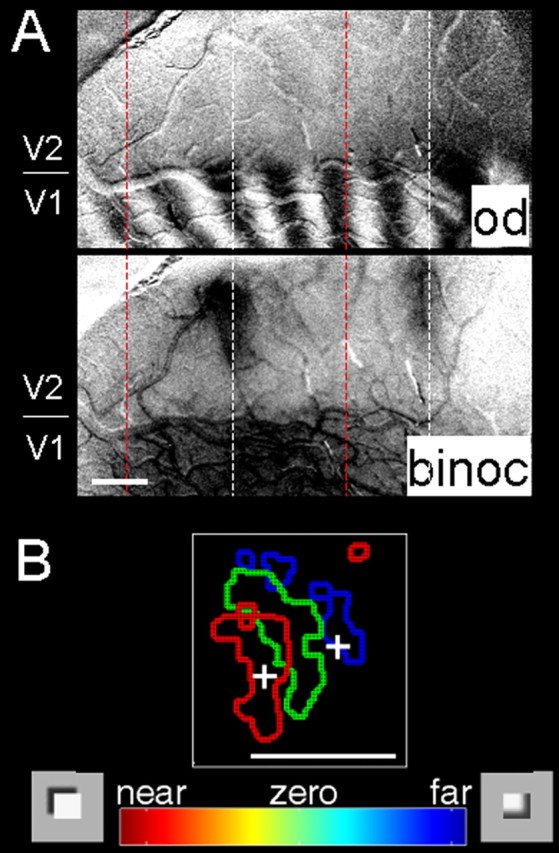
Figure 6.

Disparity representation in V2. A, Top, Optical image of ocular dominance (od) map in macaque monkey visual cortex reveals border between V1 and V2 (indicated at left). Bottom, Binocular (binoc) minus monocular map. As shown by previous studies, regions more responsive to binocular than monocular activation of V2 correspond to locations of cytochrome oxidase thick stripes (Ts'o et al., 2001). B, Near-to-far topography within V2 thick stripe. Summary map of near (red), zero (green), and far (blue) domains imaged in a thick stripe of V2 [modified with permission from Chen et al.(2006)]. Scale bars, 1 mm.
