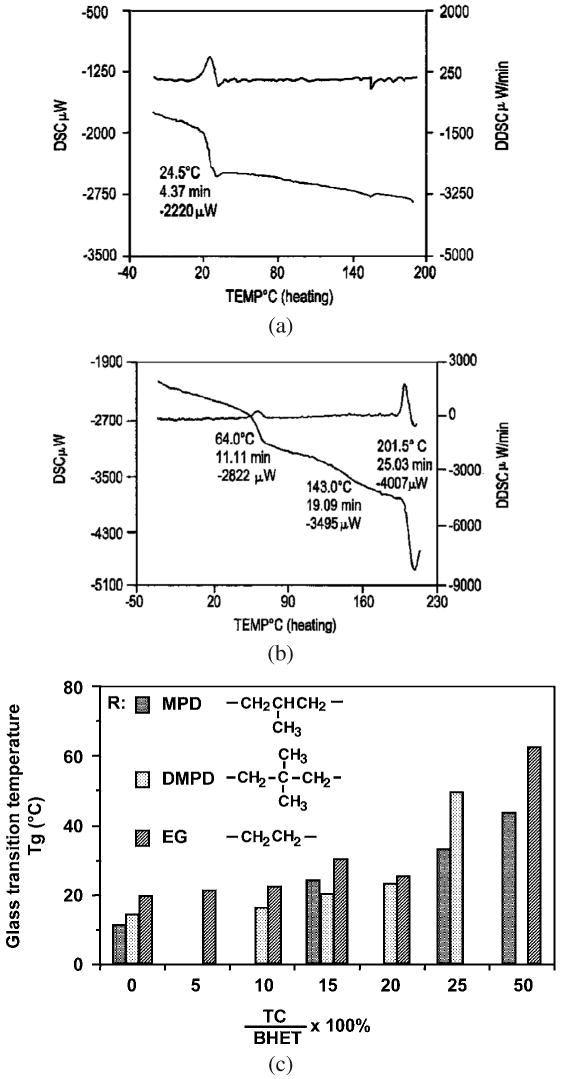
Figure 6.

(a) DSC graph for P(BHET-EOP/TC, 80 : 20). (b) DSC graph for P(BHET-EOP/TC, 50 : 50). (c) Glass transition temperature as a function of terephthalate (or phosphate) content in poly(terephthalate-co-phosphate) and the structure of the diol residue in the co-polymer backbone.
