
Fig. 1.
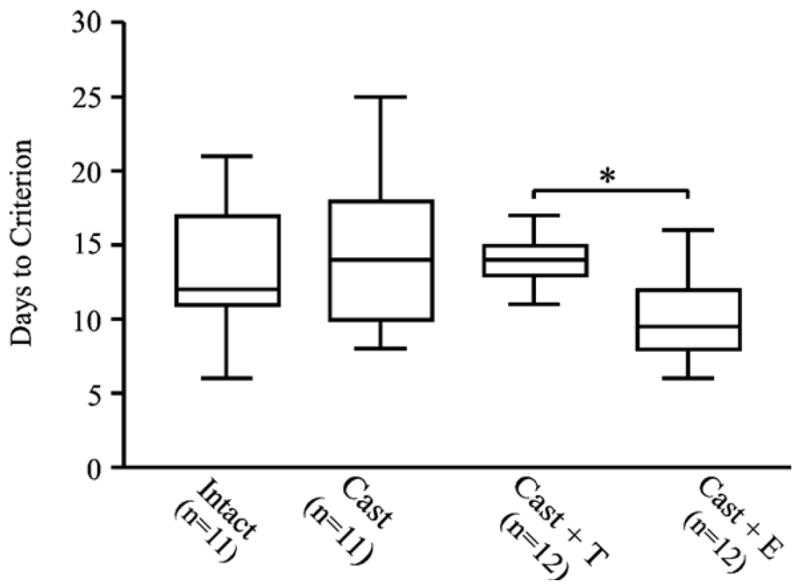
Box and whisker plots comparing the number of days to reach criterion for each of the four treatment groups. E-treated rats required fewer days to reach criterion than T-treated rats (*P < 0.05).
Official websites use .gov
A
.gov website belongs to an official
government organization in the United States.
Secure .gov websites use HTTPS
A lock (
) or https:// means you've safely
connected to the .gov website. Share sensitive
information only on official, secure websites.
Box and whisker plots comparing the number of days to reach criterion for each of the four treatment groups. E-treated rats required fewer days to reach criterion than T-treated rats (*P < 0.05).