
Figure 2.
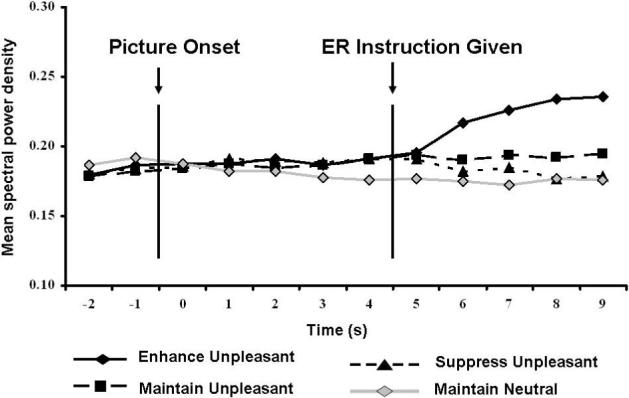
EMG for each ER Condition over time. Each value represents an average mean spectral power density over a 1 second period beginning two seconds prior to image onset and continuing through the last second of image presentation. Note: power values are presented here for ease of viewing. Statistics were calculated on log-transformed data.