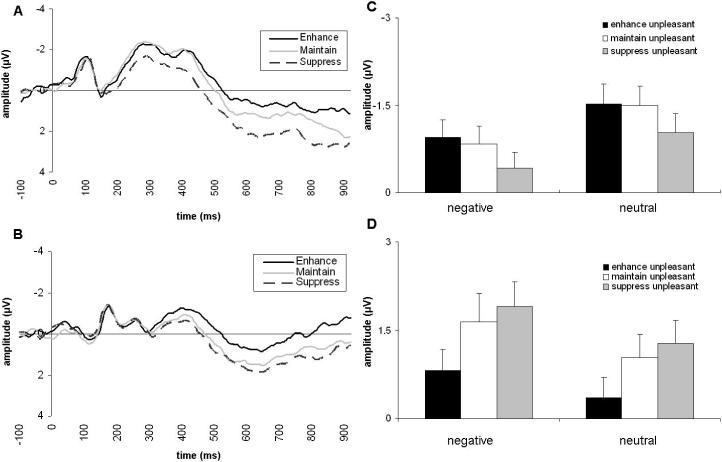
Figure 3.
N400 and P300 ERP results. Panel A depicts the grand average ERP for both negative and neutral words in the three different ER categories at a representative sensor site (Cz). Panel B depicts the grand average ERP for both negative and neutral words in the three different ER categories at Pz. Panel C represents the N400 mean amplitudes in each different ER condition for negative and neutral words. Panel D represents P300 mean amplitudes in each different ER condition for negative and neutral words. Error bars indicate standard errors.

