
Figure 2.
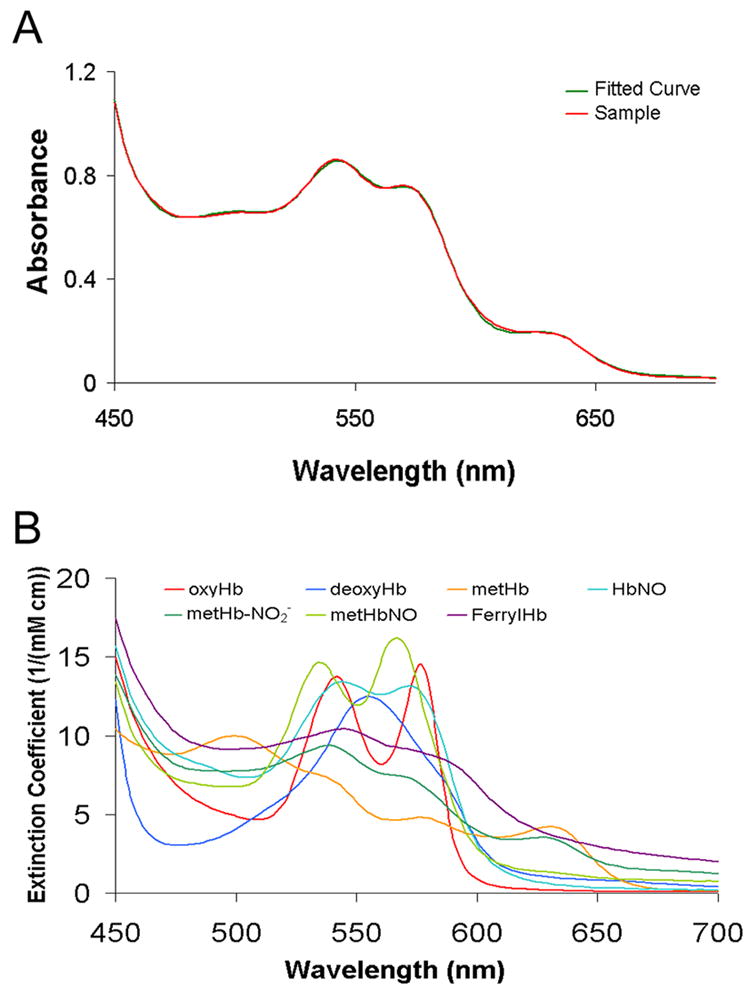
Spectral deconvolution of Hb species absortption. (A) Typical fit of an absorption spectrum showing both the raw data and the fit. HbNO found was 29%, the percentage of oxyHb was 5%, deoxyHb was 21%, the percentage of metHb was 41%, and metHb-NO2− was 4%. The data were taken from a partially oxygenated Hb sample (100 μM, 36% oxygen saturated) after incubating with 100 μM AS for 33 minutes. (B) The basis spectra used for fitting.