
Figure 8.
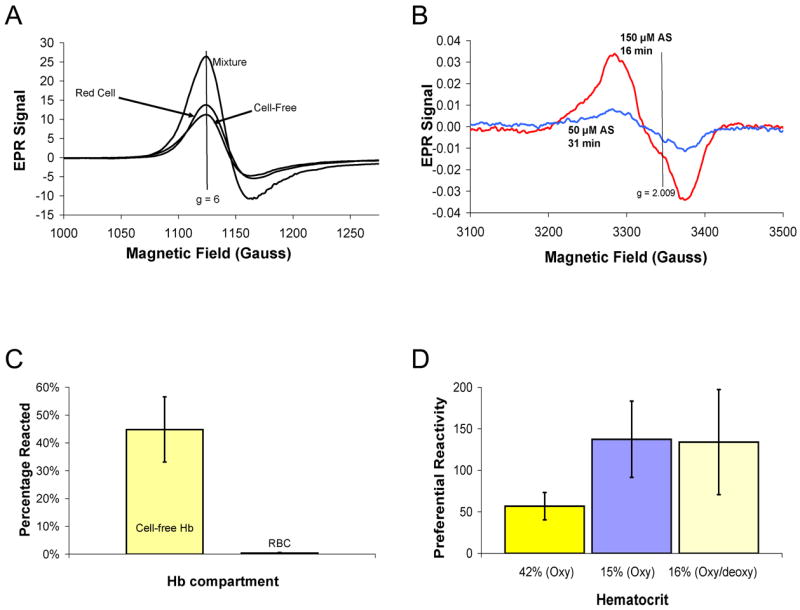
Preferential reactivity of AS. (A) Fifty micromolar AS was added to a mixture 107 μM cell-free Hb and RBCs at 41% hematocrit in aerobic conditions. After 31 minutes, the samples was analyzed for metHb formation by EPR. Spectra are shown for the cell-free Hb and red cell fractions as well as the mixture of the two. Double integration of the EPR peaks yielded 31 μM in the cell-free fraction, 36 μM in the red cell fraction, and 69 μM in the mixture. The magnetic field value corresponding to g = 6 is shown as a vertical line at 1120 G. For a control sample in which AS was not added, only 1.2 μM metHb formed due to autoxidation during 31 minutes. (B) The formation of iron-nitrosyl Hb in the cell-free fraction is demonstrated using EPR spectroscopy. One spectrum was taken from a sample where 50 μM AS was added to a mixture of RBCs at 17% hematocrit and 31 μM cell-free Hb for 31 minutes resulting in 0.5 μM HbNO in the cell-free fraction. The other spectrum was taken from a sample where 150 μM was added to a mixture of red cells at 16% hematocrit and 29 μM cell-free Hb resulting in the formation of 2 μM HbNO. The magnetic field value corresponding to g = 2.009 is shown as a vertical line at 3337 G. (C) A summary of percentage of cell-free and RBC Hb reacted after 50–150 μM AS was added to partially oxygenated (68 ± 12%) red cells at 16 ± 1% hematocrit and 30 ± 2 μM cell-free Hb after 6 minutes of the reaction. Each bar represent the percentage of reacted Hb (metHb and iron-nitrosyl Hb) compared to the total amount in that fraction. AS converted 45 ± 12 % of cell-free Hb (about 13.5 μM) to non-NO scavenging forms and only converted 0.4 ± 0.3 % of RBC encapsulated Hb (n=3). The data are shown as the average ± one standard deviation. (D) A summary of the preferential reactivity of AS is given for different conditions (data shown as average of three different preparations with error bars showing the standard deviation). The bar on the left is from data where 50 μM AS was added to red cells at 42 ± 1% hematocrit and 99 ± 7 μM cell-free Hb under completely aerobic conditions. The middle bar is from data where 50 μM AS was added to red cells at 15 ± 1% and 102 ± 2 μM cell-free Hb under completely aerobic conditions. The bar on the right is from when 50–150 μM AS was added to red cells at 16 ± 1% hematocrit and 30 ± 2 μM cell-free Hb under partially anaerobic conditions so that Hb oxygen saturation was 68 ± 12%.