
Figure 3.
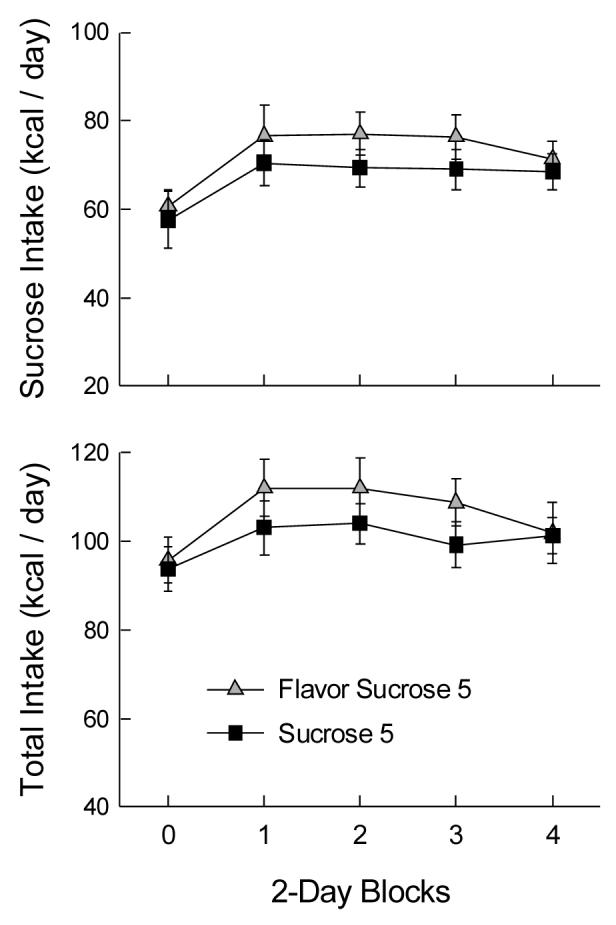
Mean (± sem) sucrose and total energy intakes in 2-day blocks of Experiment 2A. Block 0 is the baseline measure with a single bottle of sucrose. The Flavor Sucrose 5 group received five bottles of 32% sucrose solution (four with added flavors) and one bottle of water during blocks 1-4; the Sucrose 5 group received five bottles of 32% sucrose without added flavors and one of water.