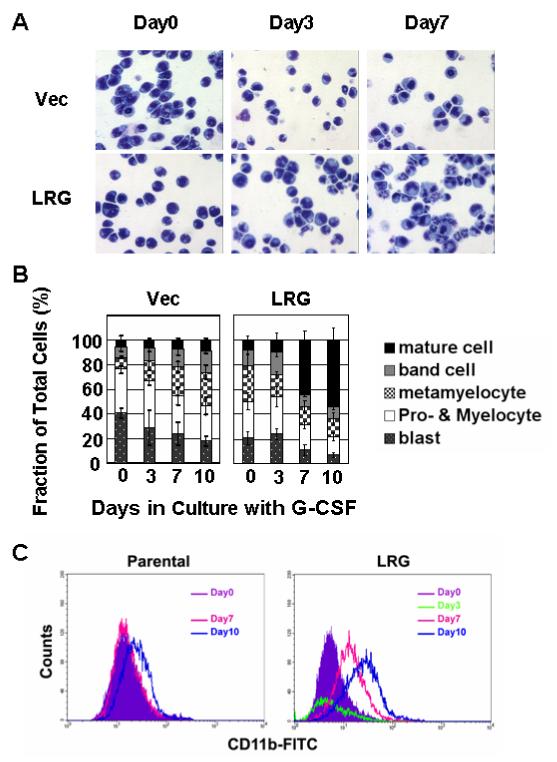
Figure 4. Accelerated neutrophilic differentiation in LRG transfected 32Dcl3 cells in response to G-CSF treatment.

(A) Cells stably transfected with vector alone or mLRG cDNA were washed out of IL-3 and transferred to G-CSF containing media. At indicated time points, aliquots of cell were cytospun onto slides. Neutrophilic differentiation was monitored by Wright-Giemsa staining. (B) Bar graphs indicate the fraction of the total cell population of cells transfected with vector alone and LRG clone at each stage of differentiation at the indicated time points. (C) Aliquots of cell were stained with FITC conjugated CD11b antibody and subjected to FACS analysis.
