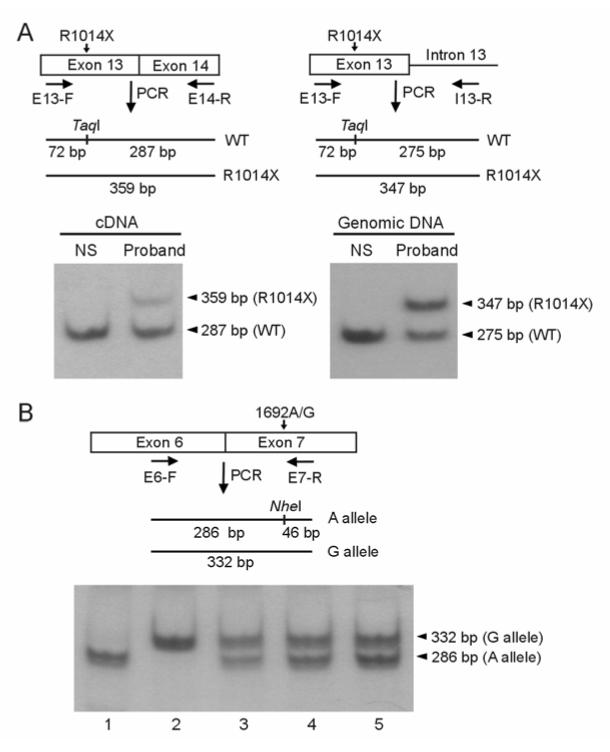
Figure 2.

Hot-stop PCR analysis of mRNA and genomic DNA isolated from lymphocytes. A: Analysis of WT and R1014X mutant alleles in a normal subject (NS) and the proband. Schematic diagrams are shown for hot-stop PCR analysis of cDNA (left panel) and genomic DNA (right panel). In cDNA analysis a forward primer in exon 13 (E13-F) and a reverse primer in exon 14 (E14-R) were used, and in genomic DNA analysis the same forward primer and a reverse primer in intron 13 (I13-R) were used. The position of TaqI and the size of the fragments from WT and mutant PCR products are shown. After digestion with TaqI, the 32P labeled hot-stop PCR products were analyzed by polyacrylamide gel electrophoresis and autoradiography. In cDNA analysis (left panel) the bands from WT and R1014X alleles are 287 bp and 359 bp, respectively and in genomic DNA analysis (right panel) the bands from WT and R1014X alleles are 275 bp and 347 bp, respectively (the 72 bp band ran off the gel). Similar results were obtained in two additional R1014X carriers and three to five independent experiments were performed for each patient. B: Analysis of allelic variation of hERG expression by analyzing 1692A/G polymorphism in five normal subjects. A schematic diagram is shown for the position of NheI and the size of the fragments from A and G alleles. The 32P labeled hot-stop PCR products were digested with NheI. The 286 bp and 332 bp bands represent 1692A and 1692G alleles, respectively (the 46 bp band ran off the gel). Results shown are representative of two independent experiments.
