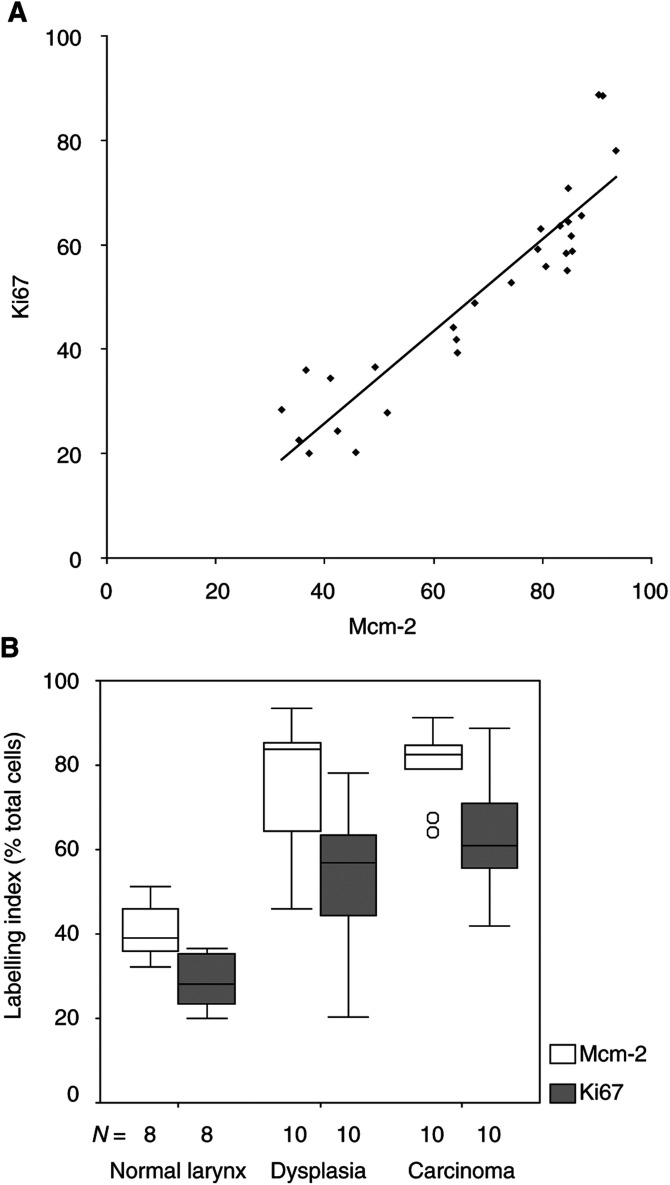
Figure 3.
(A): Correlation between Mcm-2 and Ki67 LIs for the entire epithelium in normal larynx (n=10), LD unaccompanied by invasive disease (n=10) and SCC (n=10) (ρ=0.93; 95% CI [0.84, 0.97]). (B) Comparison between Mcm-2 and Ki67 LIs for the entire epithelium in normal larynx (n=8), LD unaccompanied by invasive disease (n=10) and laryngeal SCC (n=10; median±IQR). Box=upper to lower quartile ranges; whisker=2 × quartile range; circles=extreme values.

