
Figure 5.
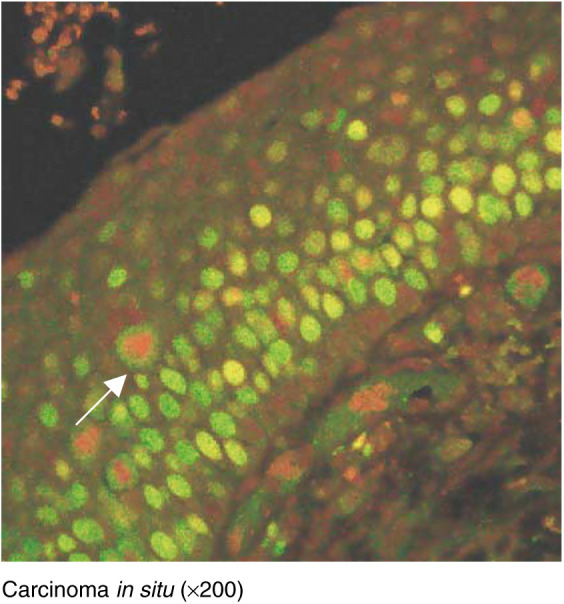
Double-labelling fluorescent confocal microscopy for Mcm-2 (green) and Ki67 (red) in carcinoma in situ. Many cells coexpress Mcm-2 and Ki67 (yellow), but there are also many cells showing Mcm-2-expression alone (green). Mitotic figures show chromatin exclusion of Mcm-2 (red staining) but the cytoplasm is positive for Mcm-2 (arrow). Some Mcm-2-expressing cells (green) are present in the superficial third whereas very few cells express Ki67 (yellow).