
Fig. 8.
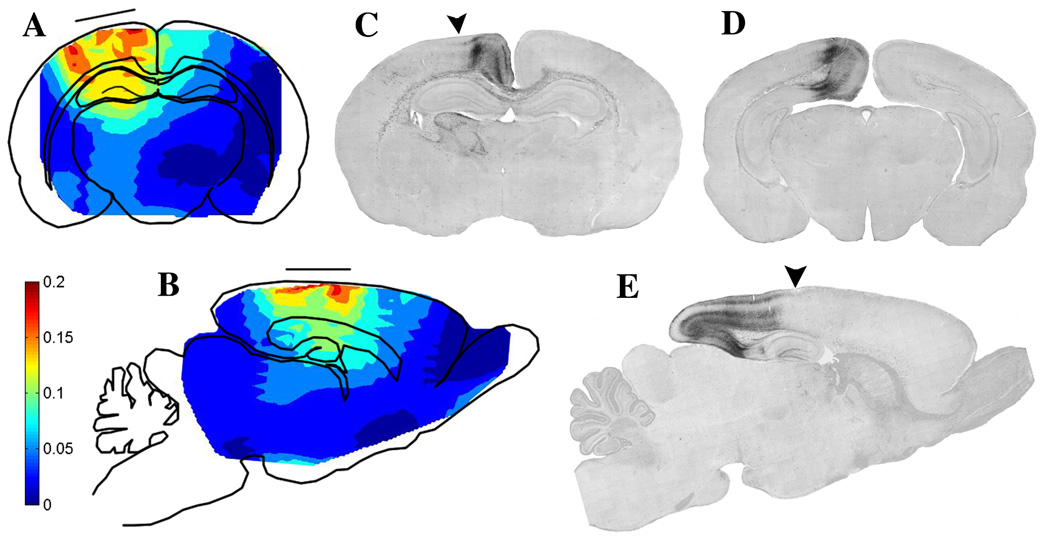
Panels A and B are schematic depictions of coronal (A) and sagittal (B) sections of the P7 rat brain illustrating the pattern of strain magnitude following a focal impact force causing parasagittal indentation of the flexible infant rat skull. The positioning of the impacter tip (solid horizontal line) is shown to allow comparison with the resultant pattern of strain (tissue deformation). A more detailed account of the method of strain measurement is described in Bayly et al. (2006). Colors represent degrees of deformation: red = 0.20 (20%) strain; deep blue = 0 strain; intermediate levels indicated by the color bar. Panels C, D, E are AC-3 stained sections from the P8 rat brain 24 hrs post impact. The arrows in C and E indicate the direction of impact and the center of the impact site. Panels C and D are coronal sections cut in a rostrocaudal plane slightly caudal to the impact site (C), or at a much more caudal level (D). These sections show that the delayed pathological reaction at the cerebrocortical level is primarily concentrated in a tissue zone medial to the point of impact. Panel E is a sagittal section revealing that this cerebrocortical delayed pathological reaction begins at the point of impact, and extends in a caudal (but not rostral) direction to the caudal pole of the brain. It encompasses continuous rows of neurons in the retrosplenial and pre and para-subicular cortices, all lying in a medio-caudal sector of the brain.