
Figure 2.
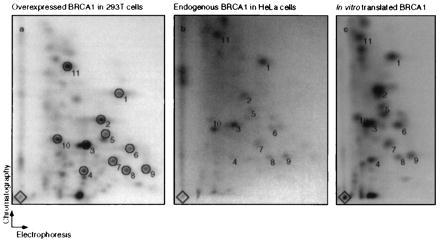
In vitro translated, immunoprecipitated endogenous, and overexpressed BRCA1 reveal the same tryptic peptide pattern. Shown are tryptic peptide maps of overexpressed BRCA1 in 293T cells (Left), endogenous BRCA1 from HeLa cells (Center), and in vitro translated BRCA1 (Right). Immunoprecipitations were performed using either Ab-C or Ab-D, and the precipitates were separated by SDS/PAGE (see Fig. 1B, lanes 1 and 2 and 4 and 5, respectively). BRCA1 from Ab-C and Ab-D precipitations was pooled for each cell type. Tryptic peptide analysis was performed on each pool. The diamonds mark sample origins. Circles (numbered 1–11) indicate common spots in the three maps. Comparable maps were also obtained for endogenous BRCA1 from pooled immunoprecipitates from 293T cells and for overexpressed BRCA1 from 293T cells analyzed after precipitation by either Ab-C or -D alone (data not shown).