
FIGURE 2—
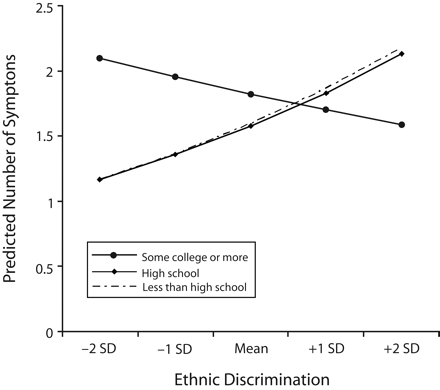
Number of somatic symptoms among Japanese Brazilians, by education and self-reported discrimination: Japan, 2000–2001.
Note. These interactions are adjusted for age, gender, marital status, Japanese lineage, income, length of residence, and Japanese language proficiency. The regression line slope for college graduates is not statistically different from zero (b = −0.02; P > .05). The regression line slopes for high school education and less than high school education are both significantly greater than zero (b = 0.08; P < .001) but did not differ from one another.