Figure 3.


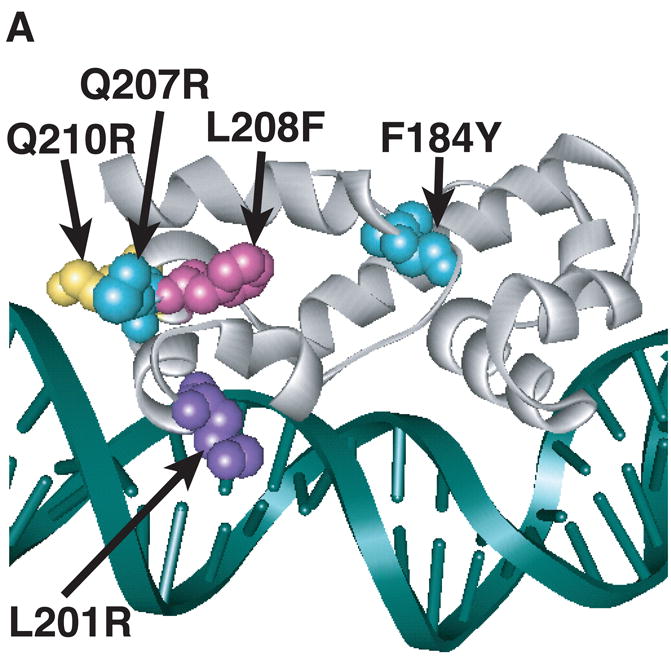
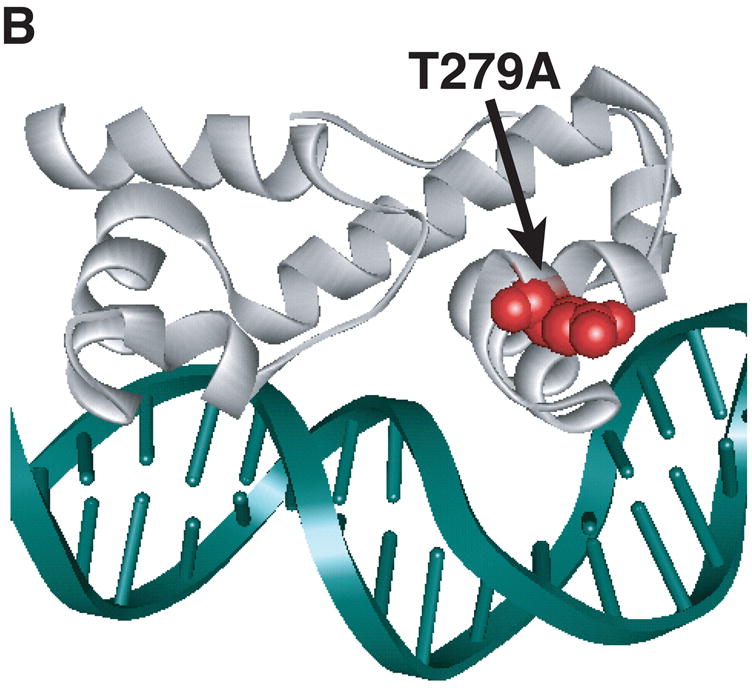
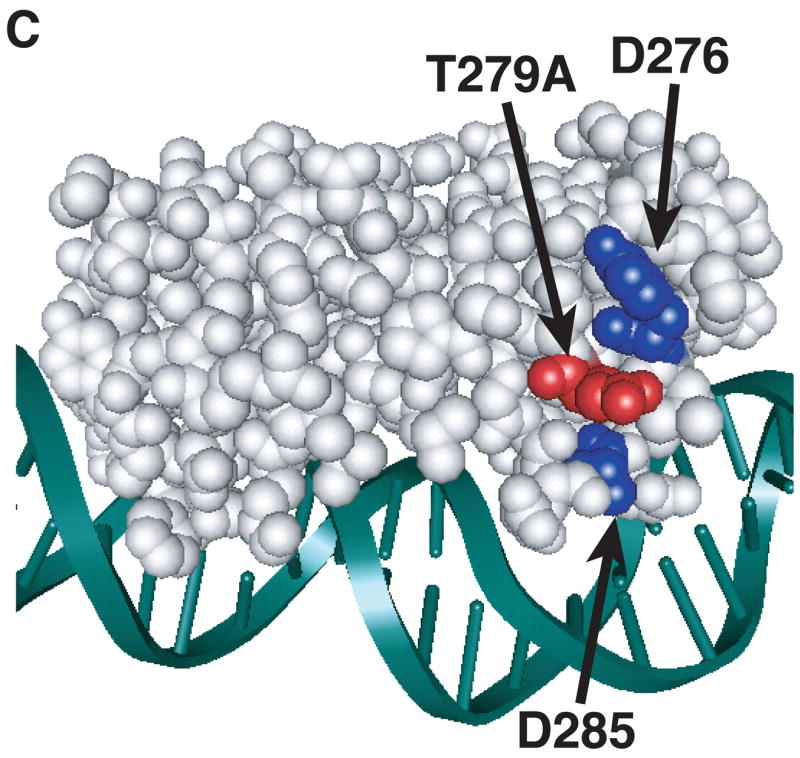
Model of substitutions leading to a constitutive phenotype within RhaS-CTD and RhaR-CTD. The structure of MarA in complex with DNA is used as a model for RhaS-CTD and RhaR-CTD (Rhee et al., 1998), with the DNA in green and MarA in light gray. The overlap with the -35 element is on the right in all cases. (A) The positions of the RhaS-CTD substitutions are shown in various colors as space filling representations on a ribbon model of MarA. The F184Y and Q207R substitutions were isolated as a double mutant. (B) The position of the RhaR-CTD substitution is shown in red as a space-filling representation on a ribbon model of MarA. (C) The position of residue RhaR T279 is shown relative to the positions of residues shown to contact RNAP in RhaS and RhaR. RhaR D276/RhaS D241 and RhaS D250 (that aligns with RhaR D285) have been shown to contact RNAP and are shown in blue (Bhende and Egan, 2000; Wickstrum and Egan, 2004). RhaR T279 is shown in red, all on a space-filling representation of MarA.
