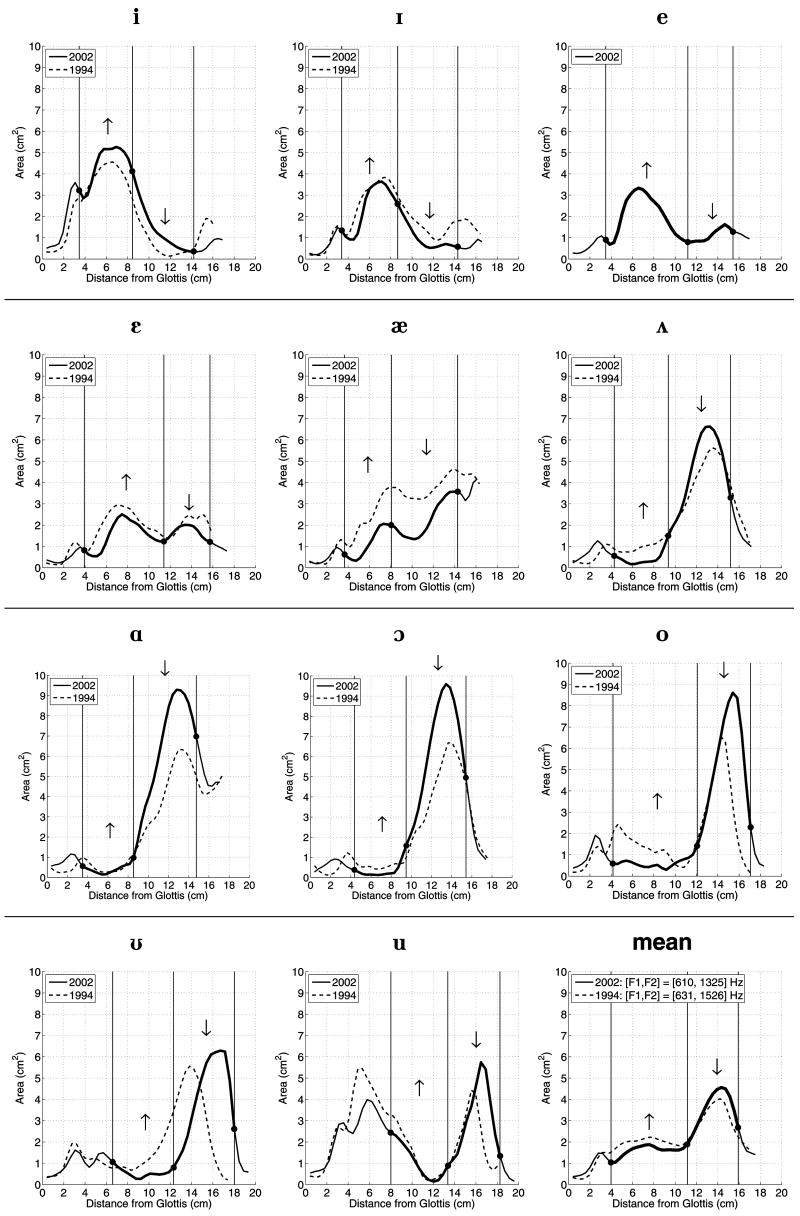
FIG. 1.
Two sets of vocal tract area functions obtained from the same speaker. The solid lines represent area functions from the present study and the dashed lines are those area functions reported in STH96. The lower right subplot contains the mean area functions from each set. The legend on each subplot designates each set according to the year (1994 or 2002) in which the images were collected with MRI. The solid dots on the 2002 area functions along with the vertical lines denote regions within which a change of cross-sectional area, in the direction of the arrows, would increase F2.

