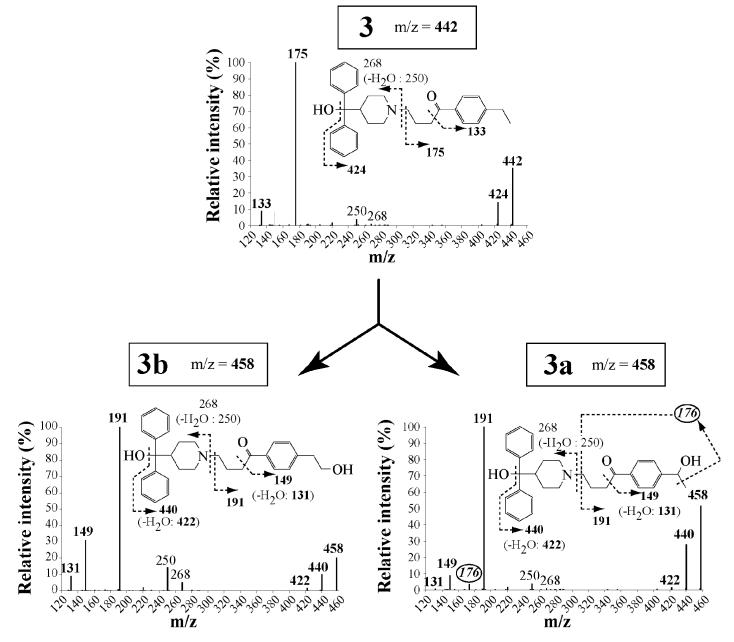
Figure 3. Mass spectra of compound 3 and of its products formed upon oxidation by CYP2J2.
Mass spectra were obtained from HPLC-MS2 and MS3 analysis of incubations of 20 μM 3 with 5 nM CYP2J2 and a NADPH-generating system for 30 min, as described in Materials and Methods. The m/z values corresponding to 3 and its oxidation products (3a and 3b) are indicated into squares. Fragments containing the hydroxylated carbon are indicated in boldface. The m/z value of the characteristic fragment for identification of compound 3a is circled.

