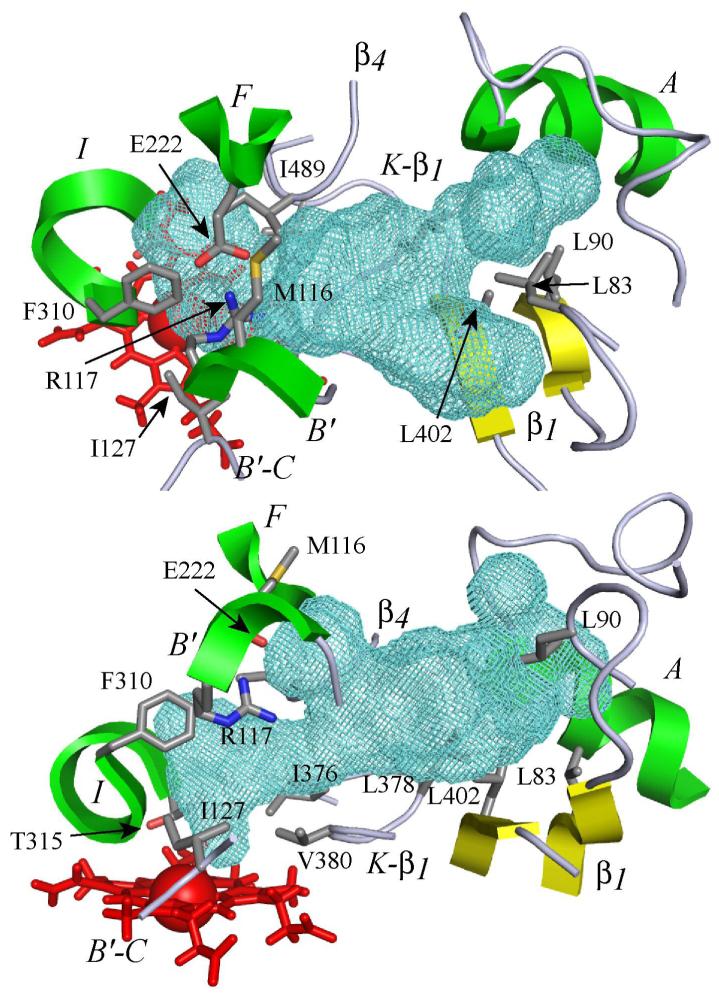
Figure 5. 3D model of the substrate binding site of CYP2J2 and cavity contours.
The active site is viewed perpendicular (top) and parallel (bottom) to the heme. The heme is represented by red sticks with the iron atom shown as a Van der Waals sphere. The active site cavity surface is rendered with a green mesh calculated using VOIDOO (42) with a probe size of 1.4 Å. Portions of the structural elements of the protein surrounding the active site (helices A, B’, F and I; β1 and β4 sheets) are rendered as green (helices) or yellow (sheets) cartoons. Portions of B’-C and K-β1 loops are rendered as grey ribbons. The residues bordering the cavity are shown (sticks), with side chain atoms colored in grey for carbon, red for oxygen, blue for nitrogen and orange for sulfur.

