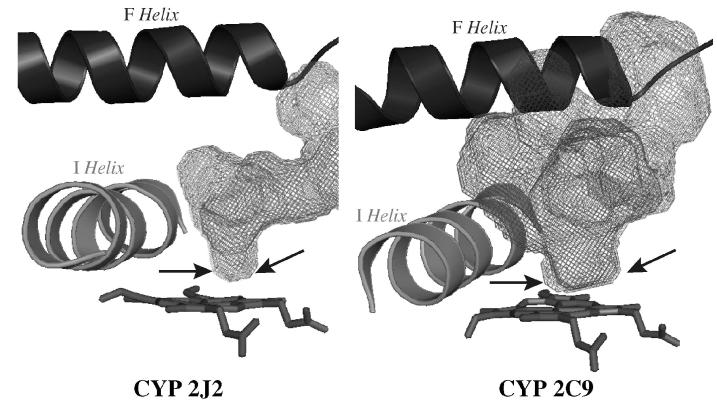
Figure 6. Comparison of the active sites of CYP2J2 and CYP2C9.
The active site cavities for CYP2C9 (pdb 1r9o) and CYP2J2 model were calculated using VOIDOO (42) and are represented as grey mesh. The heme is rendered in sticks and F and I helices as ribbons. The arrows indicate the width of the active site cavity available to the substrate in close proximity to the heme.

