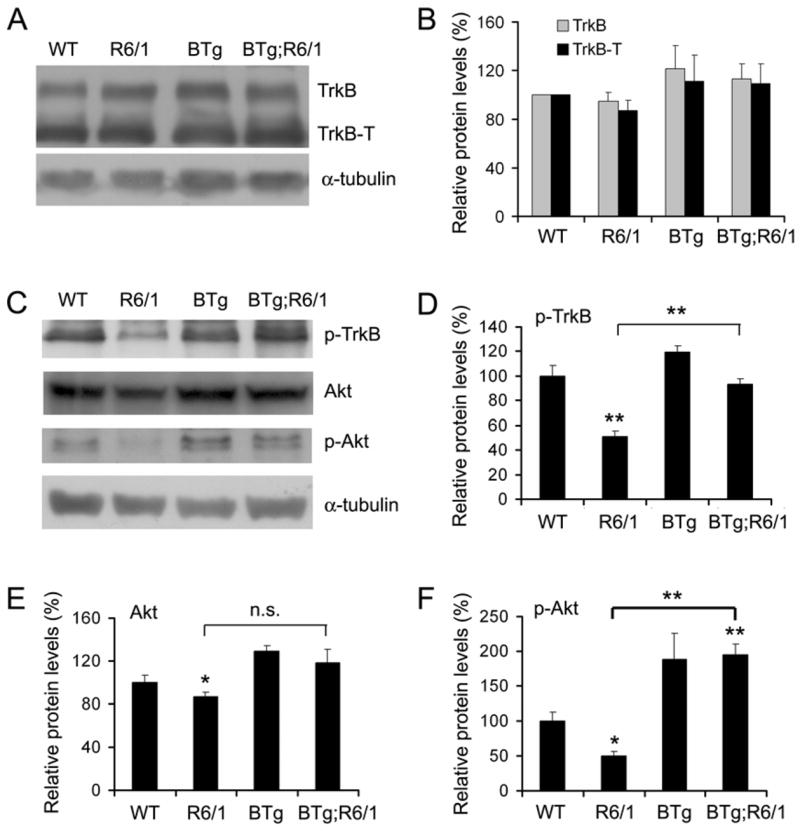
Figure 2.

Expression and activation of the TrkB receptor in R6/1 and Bdnf transgenic mice. A, Representative Western blots show expression of the full-length TrkB receptor (TrkB) and the truncated TrkB receptor (TrkB-T) in the striatum. B, Levels of TrkB and TrkB-T are similar in striata of WT (n=4), R6/1 (n=4), BTg (n=4), and BTg;R6/1 (n=3) mice. The graph represents the average of three independent experiments. C, Representative Western blots show levels of activated TrkB (p-TrkB), Akt, and activated Akt (p-Akt) in the striatum. D–F, Striatal levels of p-TrkB, Akt, and p-Akt in WT (n=4), R6/1 (n=3), BTg (n=4), and BTg;R6/1 (n=3) mice. Student’s t test: *, P<0.05; **, P<0.01.
