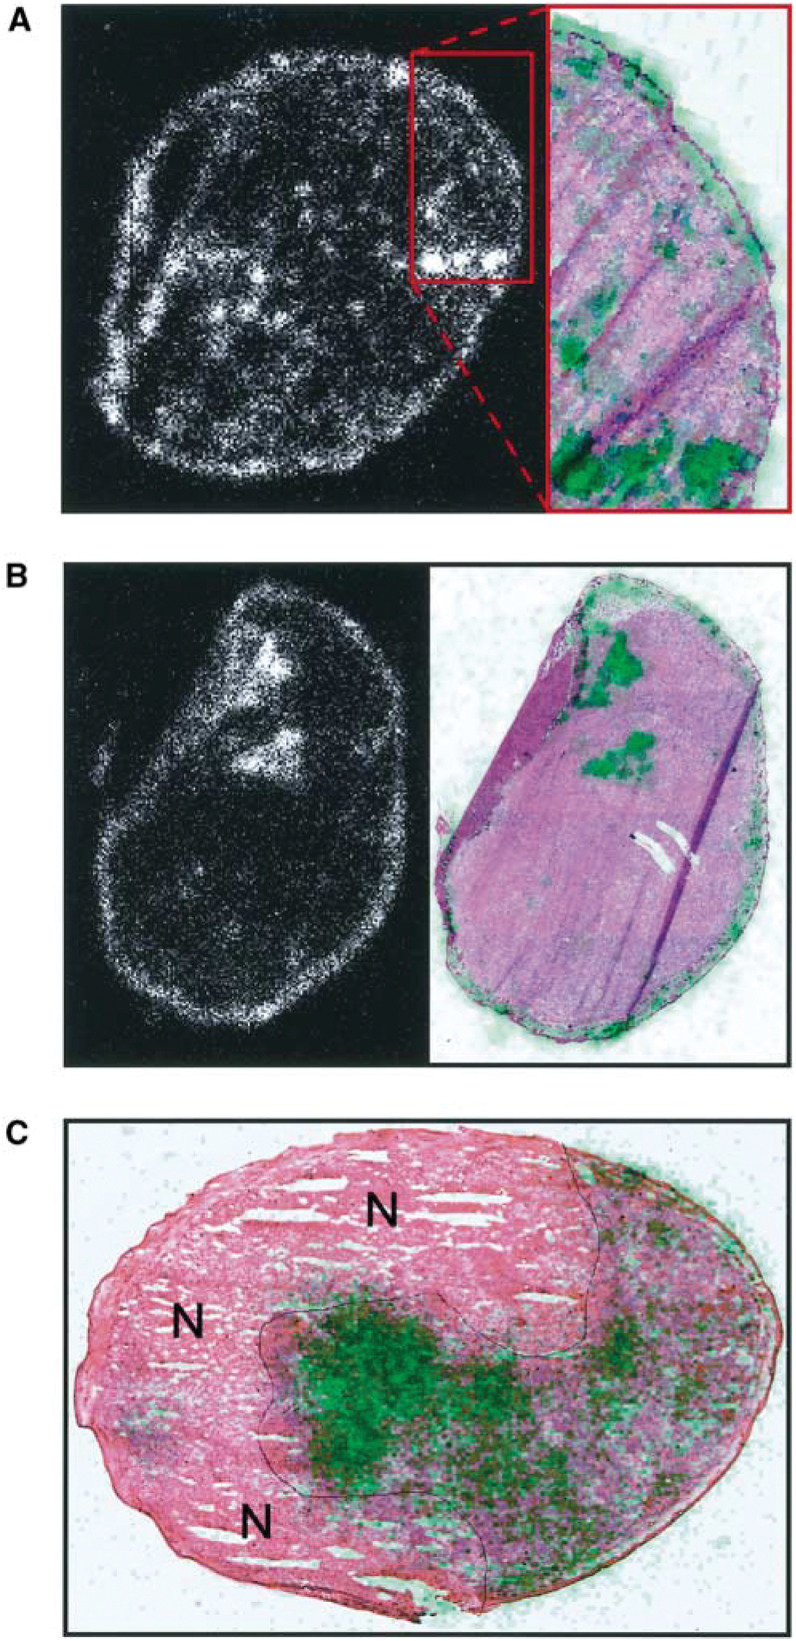
Figure 2.
(A) Left: Bioscope image of an R-18 tumour. 99mTc-HSA was administered intravenously to the tumour-bearing mouse. The mouse was killed and the tumour was frozen in liquid nitrogen 1 min after the administration of 99mTc-HSA. The concentration of 99mTc-HSA in the tumour tissue is proportional to the intensity in the Bioscope image. Right: histological image of the tumour region demarcated with red lines in the Bioscope image. Low-pass-filtered Bioscope image, showing the concentration of 99mTc-HSA in green, is superimposed on the histological image. (B) Left: Bioscope image of an R-18 tumour. 99mTc-HSA was administered intravenously to the tumour-bearing mouse. The mouse was killed and the tumour was frozen in liquid nitrogen 60 min after the administration of 99mTc-HSA. The concentration of 99mTc-HSA in the tumour tissue is proportional to the intensity in the Bioscope image. Right: histological image of the same tumour section. Low-pass-filtered Bioscope image, showing the concentration of 99mTc-HSA in green, is superimposed on the histological image. (C) Histological image of a D-12 tumour. Low-pass-filtered Bioscope image, showing the concentration of 99mTc-HSA in green, is superimposed on the histological image. 99mTc-HSA was administered intravenously to the tumour-bearing mouse. The mouse was killed and the tumour was frozen in liquid nitrogen 180 min after the administration of 99mTc-HSA. Necrotic regions are indicated by N.

