Figure 1.
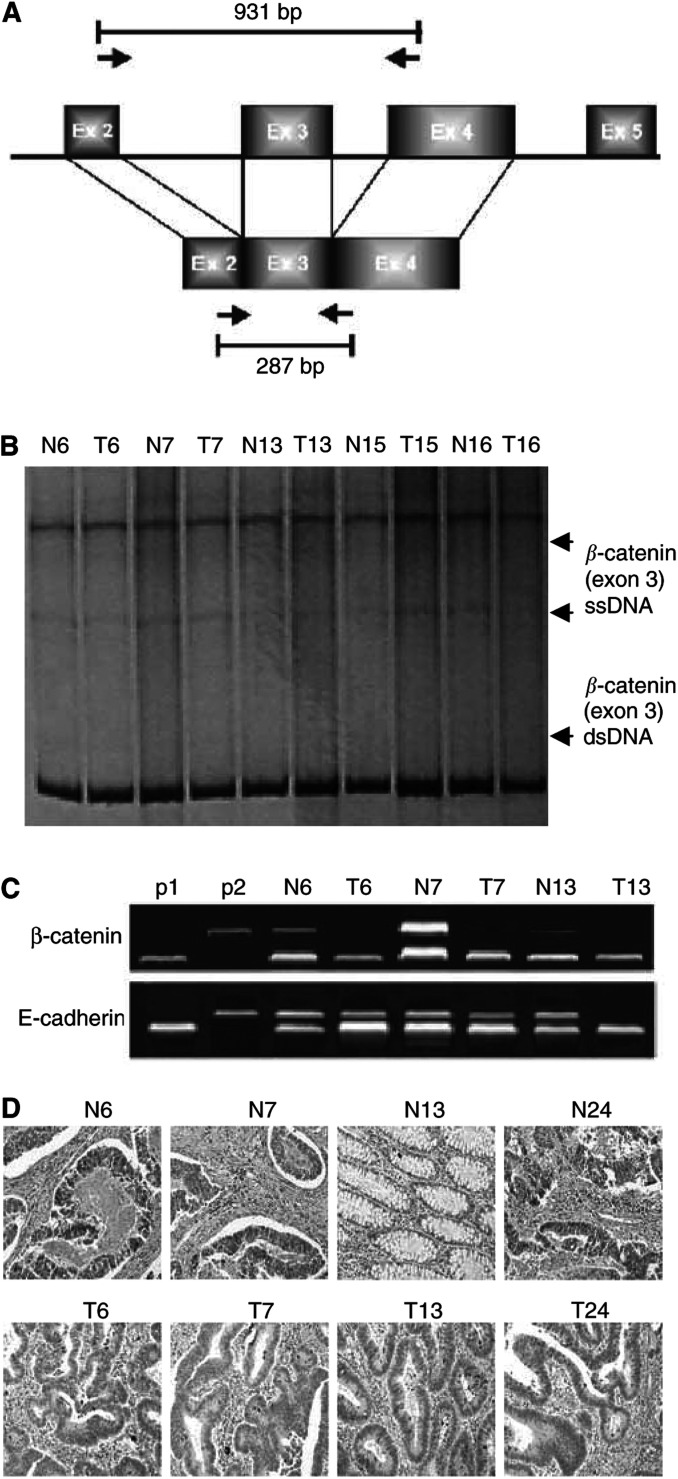
(A) Schematic representation of the primer set used to amplify genomic DNA and cDNA of the β-catenin gene. (B) SSCP analysis of the β-catenin exon 3. Arrowheads indicate single-stranded (ss) and double-stranded (ds) DNA. (C) RT–PCR analysis of the β-catenin and E-cadherin mRNA levels. P1 and P2 represent 18S rRNA and β-catenin or E-cadherin positive controls, respectively. As an example, samples 6, 7 and 13 demonstrated a decrease of mRNA expression in both E-cadherin and β-catenin followed by a parallel decrease in E-cadherin protein expression as depicted in D. (D) E-cadherin immunohistochemical detection in SCRCs in tumour (T) and adjacent normal tissue (N) sections. Samples N6, N7, N13 and N24 demonstrated a uniform expression of E-cadherin protein along intercellular borders in normal colonic mucosa. Samples T6, T7, T13 and T24 exhibited a decreased and diffused cytoplasmic staining with occasional intensified immunoreactivity at the luminal surface.

