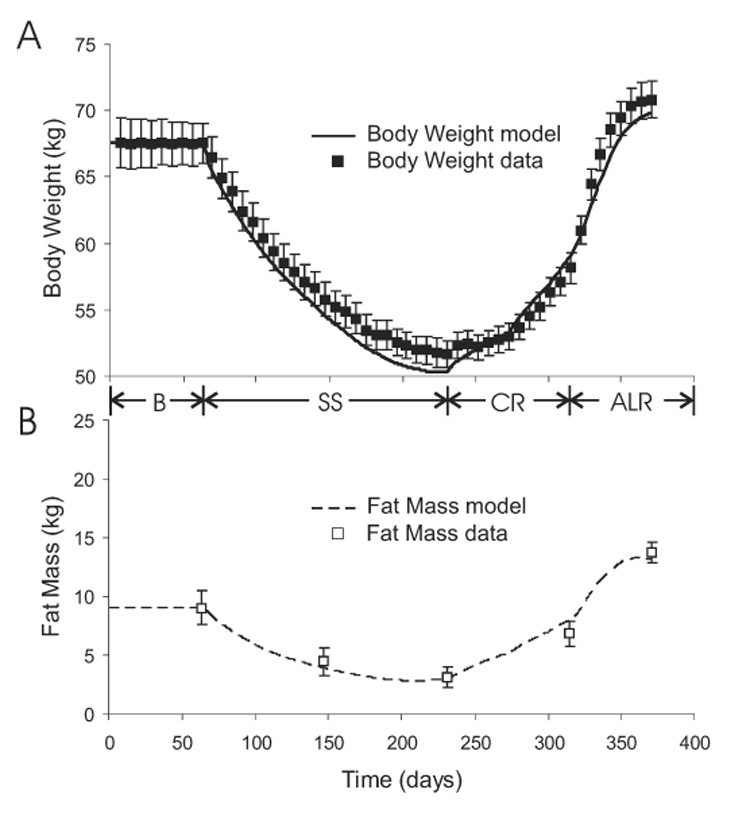
Figure 2.

Model simulation (curves) and experimental measurements (boxes) of body weight (panel A) and fat mass (panel B) during baseline (B), semi-starvation (SS), controlled re-feeding (CR), and ad libitum re-feeding (ALR) phases of the Minnesota human starvation experiment.
