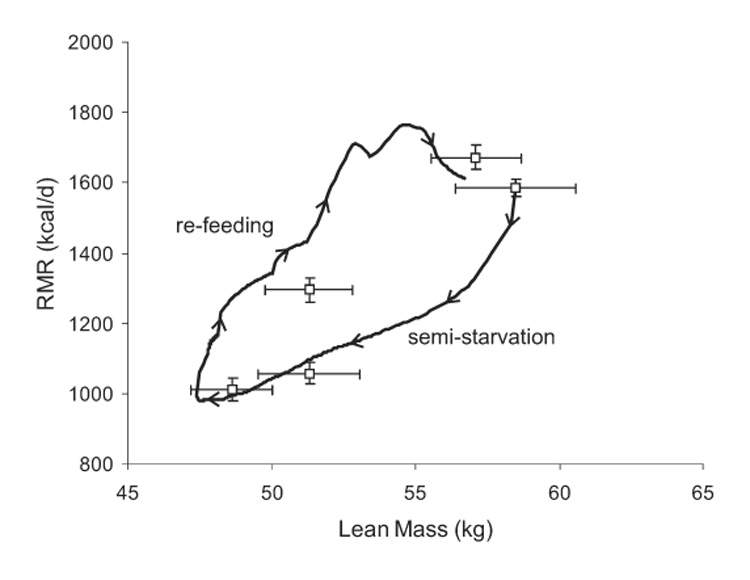
Figure 5.

Model simulation (curve) and measurements (□) of RMR versus lean body mass where the sequence of events is indicated by the arrows on the curve traced during the simulation. The measured RMR when the lean mass was 51.3 ± 1.5 kg was significantly lower during semi-starvation than during re-feeding (P < 0.0001).
