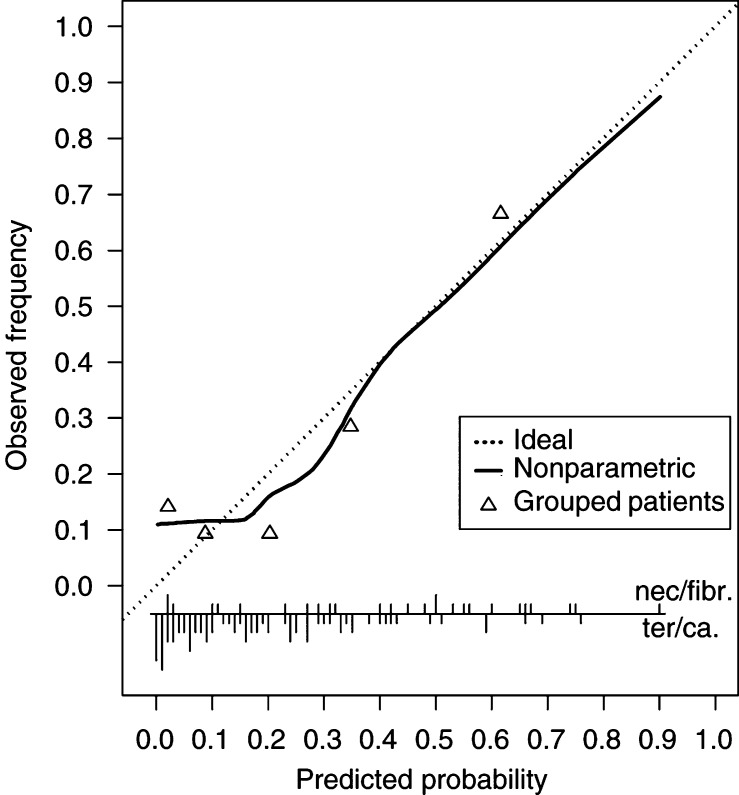
Figure 2.
Calibration curve of the prediction rule in patients of the EORTC-30941/MRC-TE20 study. Vertical lines at the bottom indicate the distribution of the predicted probabilities; lines upwards represent patients with a benign mass, lines downwards patients with tumour. Triangles indicate the frequency of benign masses grouped per quintile of predicted probabilities. The solid line shows the relation between predicted probabilities and observed frequencies. Ideally, this line equals the dotted line.

