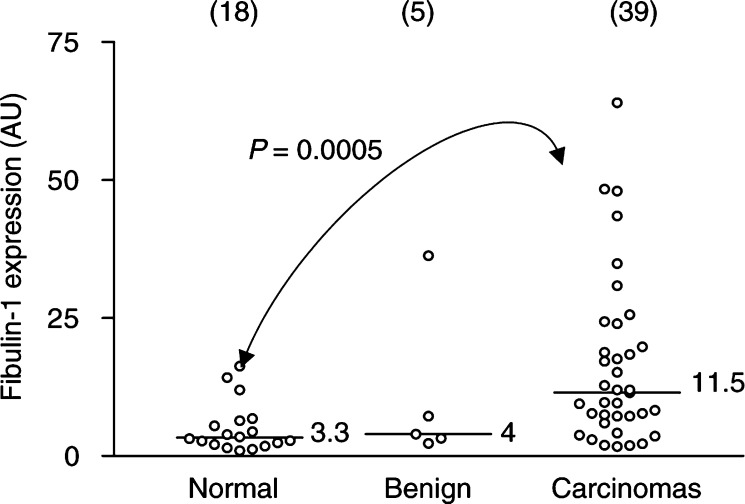
Figure 3.
Comparison of full-length fibulin-1 protein expression in normal breast tissues (n=18), benign tumours (n=5) and breast carcinomas (n=39). Levels of 100 kDa fibulin-1 were quantified by densitometric analysis and expressed in arbitrary units. Bar, median value. P-values were determined according to the nonparametric Mann–Whitney U-test for unpaired values. Full-length fibulin-1 protein was significantly elevated in the breast carcinoma specimens as compared to normal breast (P=0.0005).

