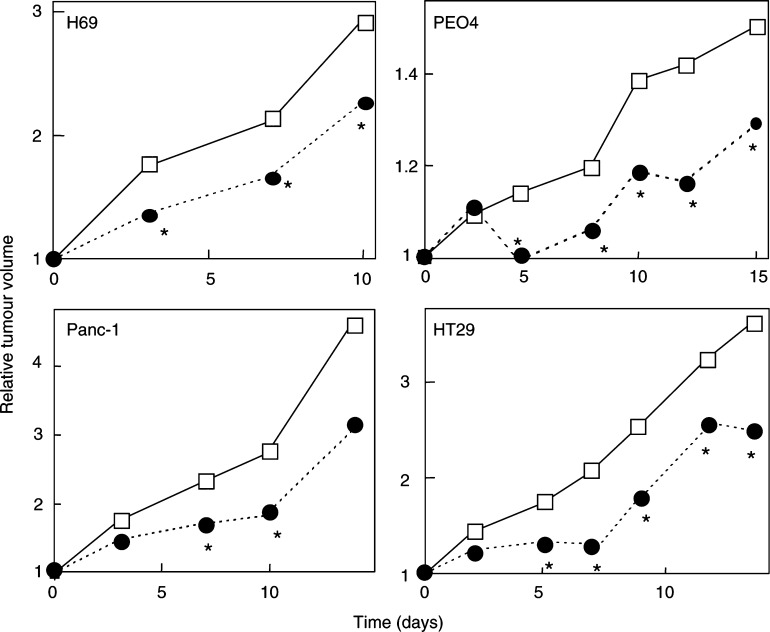
Figure 4.
Effect of SP-G on the growth of H69, HT29, PE04 and PANC-1 xenografts. Four cell lines from the original panel were established as xenografts from their respective cell lines: H69 SCLC, HT29 colon carcinoma, PEO4 ovarian cancer and PANC-1 pancreatic cancer. Typical growth curves are shown for each xenograft after i.p. treatment with 50 mg kg−1 SP-G (•) or vehicle control (□) as five separate injections administered over 3 days as two injections on day 1 and 2 separated by a 6-h gap with the final injection given on day 3. The results represent the mean tumour volumes from a single study (n=6–8). *Statistically significant from vehicle control (Students' t-test, P<0.05).

