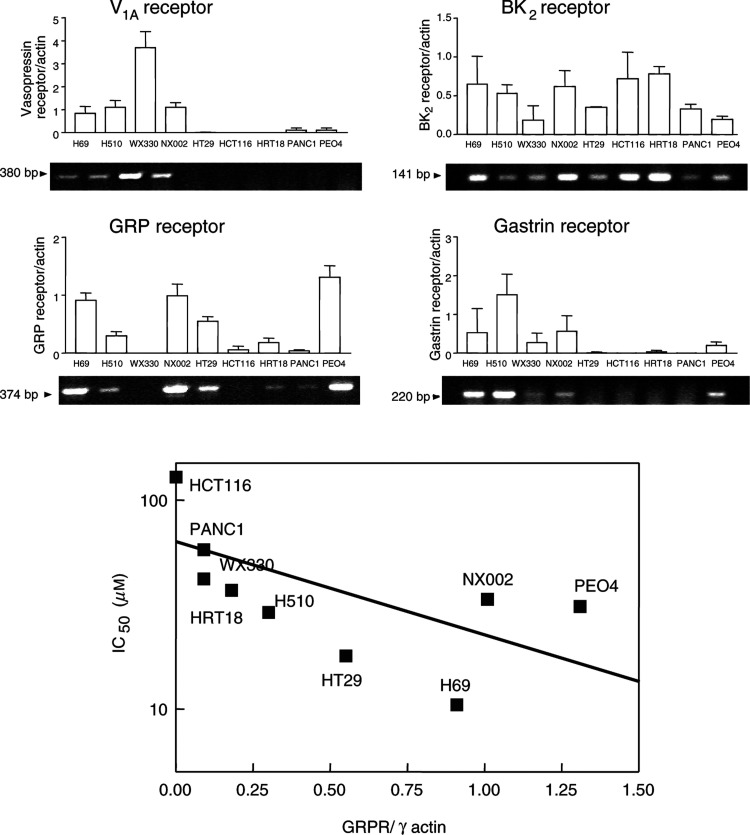
Figure 5.
Upper panel: Correlation between neuropeptide receptor expression and sensitivity to SP-G in tumour cell lines. mRNA encoding the GRP, V1A, BK2 and gastrin receptors was detected by semiquantitative RT–PCR. γ-Actin mRNA levels were measured as an internal control for each PCR reaction. The results show a representative PCR reaction for each of nine tumour cell lines, which represent a spectrum of sensitivity to SP-G. A bar chart showing relative receptor expression, calculated as density of PCR product/actin is shown for each receptor. The results represent the mean±s.e.m. of four independent experiments. Lower panel: Correlation graph between GRPR expression and inhibition of cell growth (IC50) for each of nine tumour cell lines as indicated (Spearman's R value=−0.75, P=0.026*).

