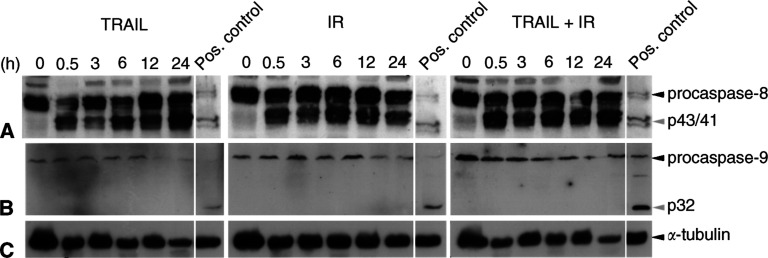
Figure 6.
Western blot analysis demonstrating marked cleavage of procaspase-8 (A) into its active p43- and p41-fragments after exposure of clearCa-22 cells to TRAIL (10 ng ml−1) or IR (1 Gy) alone and in combination. No cleavage of procaspase-9 (B) in clearCa-22 cells after exposure to TRAIL or IR alone and in combination. (cleavage of procaspase-8 and -9 in J16 cells after exposure to CH11 (500 ng ml−1) was used as a positive control). Expression of α-tubulin (C) shows equal amounts of protein loaded in each lane.

