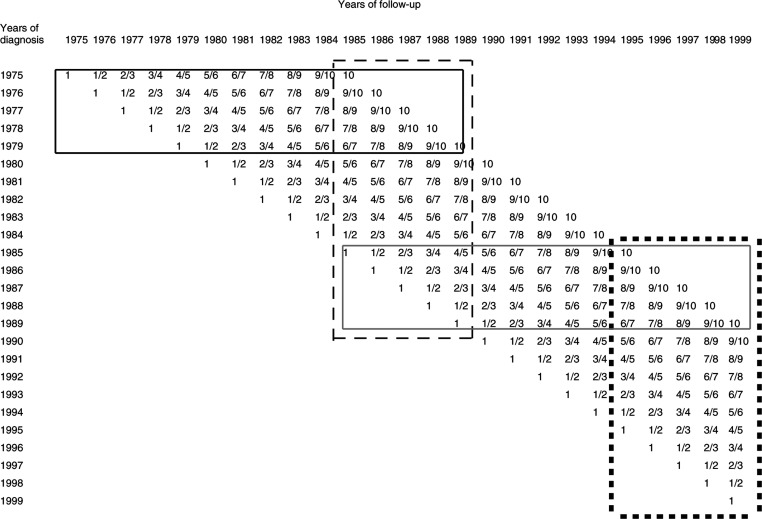
Figure 1.
Database for the 10-year survival curves actually observed for patients diagnosed in 1985–1989 (solid grey frame), and for the most up-to-date estimates of 10-year survival curves available in 1985–1989 by period analysis (dashed black frame) or cohort analysis (solid black frame). The black squares frame indicates the database for the most up-to-date period estimates of 10-year survival curves available in 1995–1999. The numbers within the cells indicate the years of follow-up since diagnosis.

