
Figure 1.
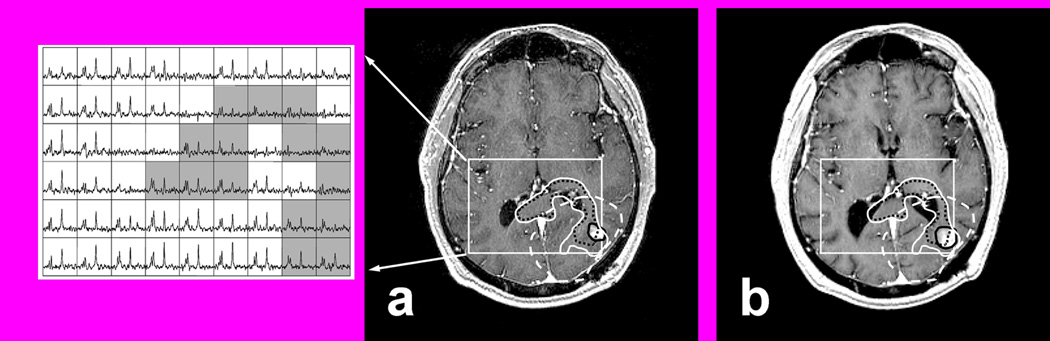
T1 SPGR post contrast at pre-RT with corresponding multi-voxel spectra (a) and at 2 months post RT (b) with superimposed regions of interest (ROIs). ROIs include PRESS (rectangular box), CE (black solid line), 60 Gy (white dashed line), CNI2 (black dotted line), MRI/S (white solid line). Note that the CNI2 suggests tumor infiltration along the posterior aspect of the corpus callosum with crossing to the contralateral side which did not appear hyperintense on T2 weighted MRI.