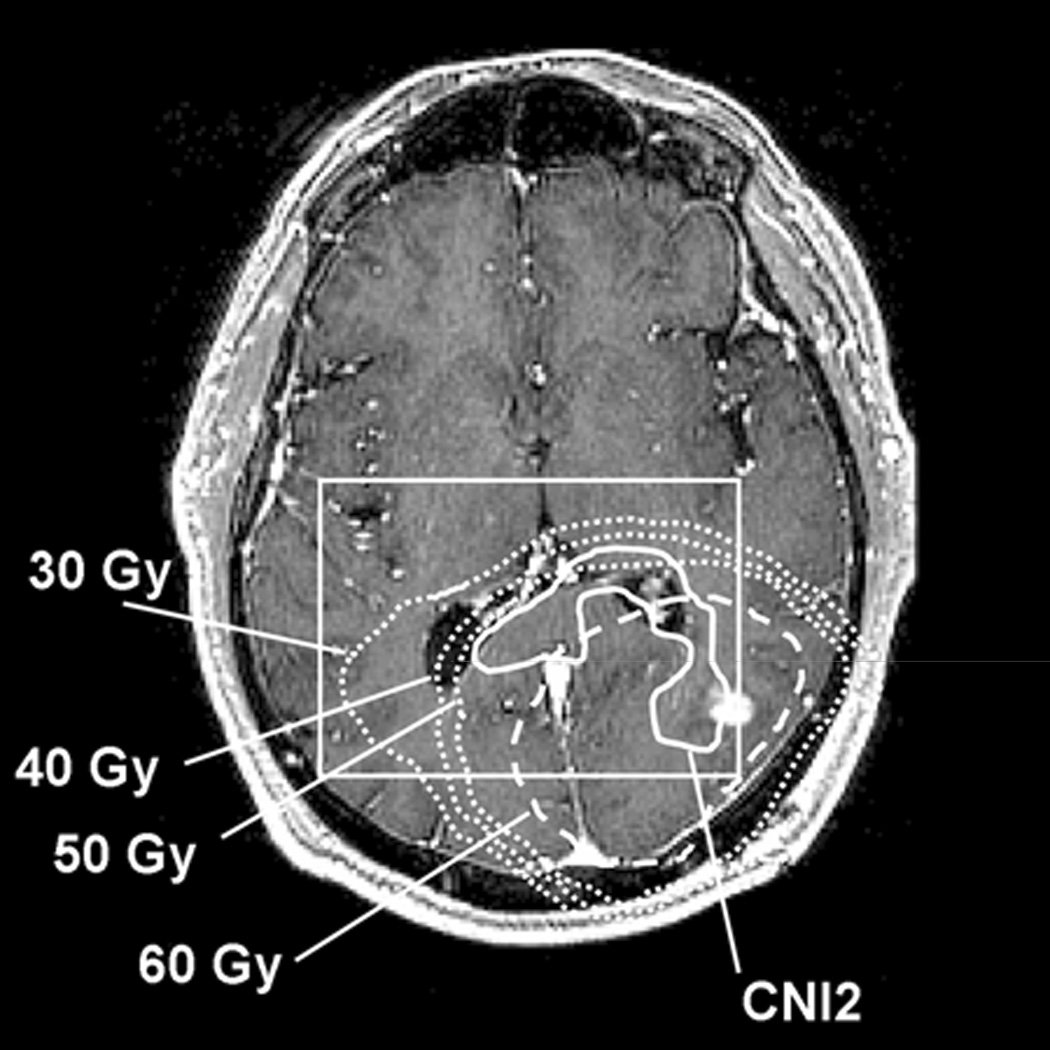
Figure 2.

Detailed dose distribution of the same patient as in Fig. 1 with the CNI2 region extending outside the 60 Gy isodose line (CNI2 solid line, 60 Gy dashed line). Additional isodose lines for 30, 40, and 50 Gy are displayed as square dotted lines (outside to inside).
