
Figure 5.
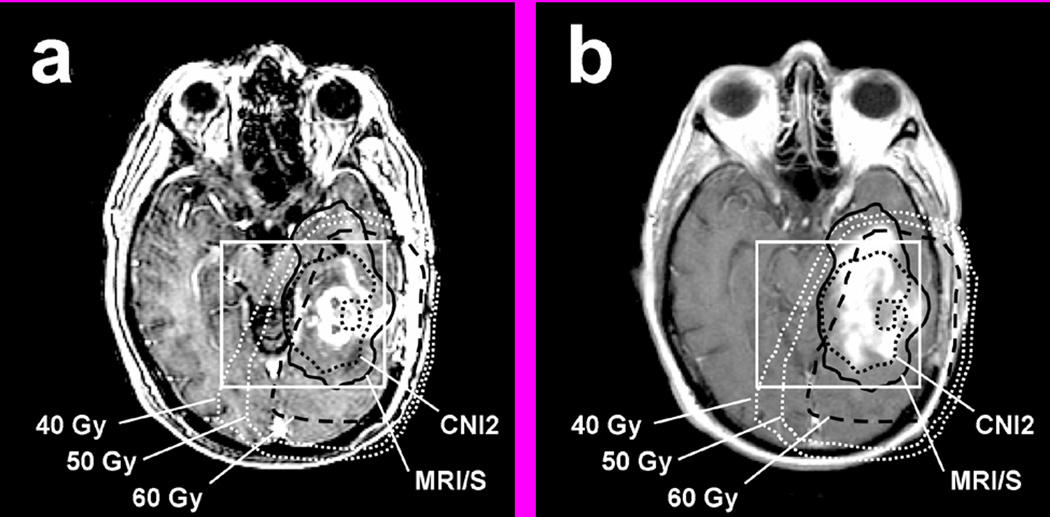
Example of increasing CE within MRI/S (black solid line) that was not entirely covered by 60 Gy (black dashed line): (a) T1 SPGR at Pre-RT. (b) T1 SPGR at 8 months post RT. Note the limited coverage of the anterior and lateral portion of the temporal lobe due to current spatial and size limitations in the PRESS prescription.