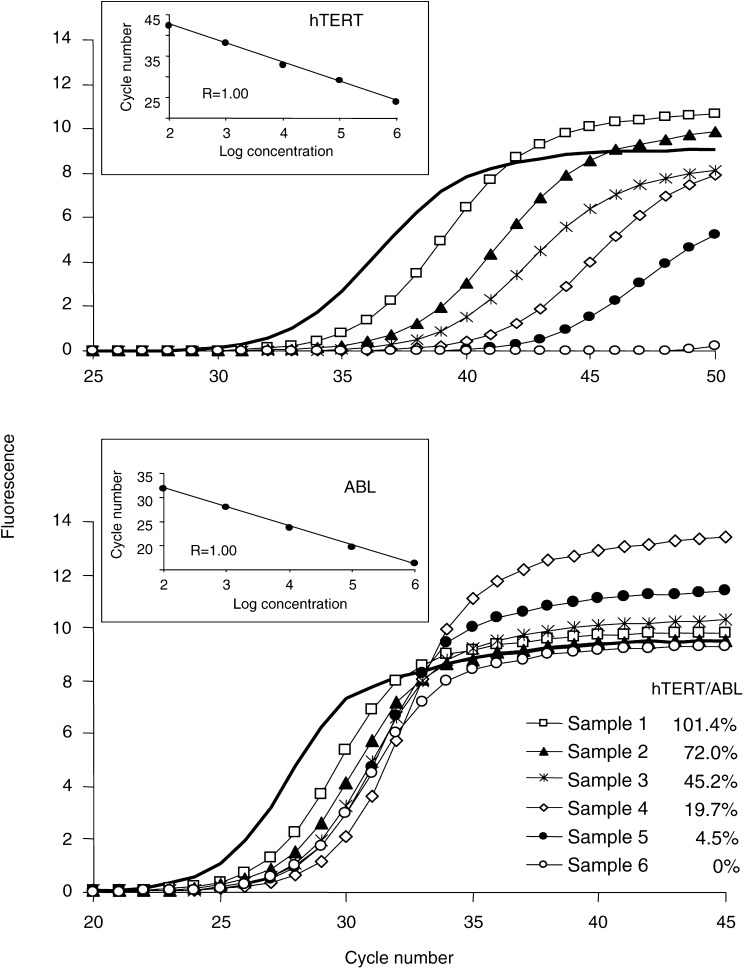
Figure 1.
Example of real-time PCR quantification of hTERT in tumour samples. Amplification profiles obtained on the LightCycler are presented for hTERT (upper graph) and ABL (lower graph) transcripts. Linear regressions of standard dilution series, indicating accuracy of the analysis, are shown on the upper left part of each graph. Calculation of the number of hTERT and ABL transcripts was done by using these standard curves. One of the standards was included in each PCR run (amplification profiles shown as solid lines, 105 molecules). For each sample, the number of hTERT transcripts was divided by the number of ABL transcripts in order to standardise the level of hTERT mRNA. The obtained ratios expressed as percentage are shown.

