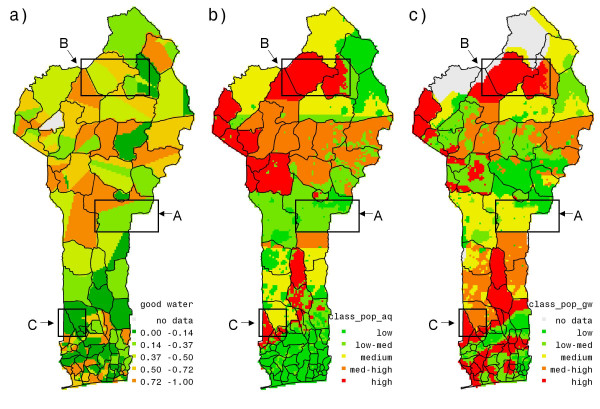
Figure 3.
(a) Accessibility to good water source, (b) aquifer suitability stress index, (c) ground water quality stress index. Figure 3 (a) is created by averaging binary variable, GW, of accessibility to good water source at household level to the cluster level. In figures 3 (b) and (c) higher values indicate poorer aquifer suitability under higher population densities and poorer ground water quality under higher population densities respectively.

