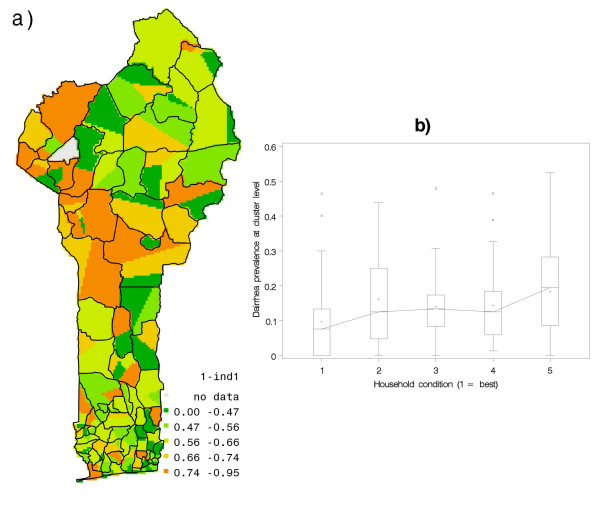
Figure 4.
(a) Indicator of household characteristics at cluster level, and (b) variability in diarrhea prevalence by socio-economic conditions at household level. In Fig 4 (a), the indicator of household characteristics is closer to 1 for poorer household conditions. The x-axis in Fig 4 (b) shows 1-Ind1, classified into 5 equiprobable classes with increasing magnitude of 1-Ind1, wherein higher class values imply poorer household conditions.

