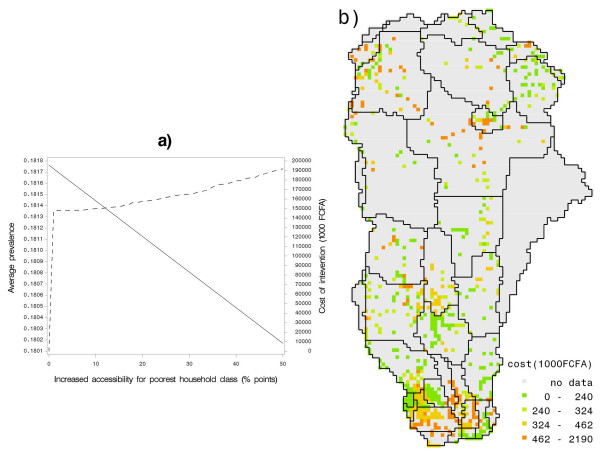
Figure 7.
(a) Change in average prevalence over the basin with policy intervention of increasing accessibility to the lowest household class (red) and total cost of these interventions (blue). (b) Spatial distribution in the ORB for the cost of increasing accessibility of the lowest household class by reducing the fraction of households with poor access by half.

