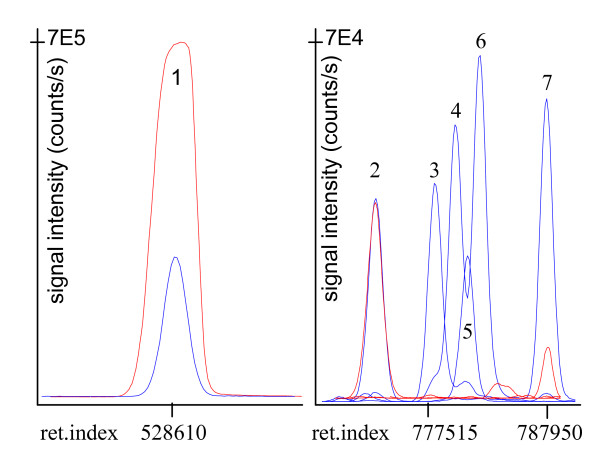
Figure 2.
Comparison of C. reinhardtii GC-TOF metabolite profiles by polar fractionation and sample overloading (red ion traces) versus injecting complete extracts (blue) with optimized extraction and injection methods. Left panel, peak #1 glutamate m/z 246. Right panel, signal intensity normalized to peak #2 (unidentified sugar phosphate). Peak #3 linoleic acid m/z 337, #4 and #6 oleic and elaidic acid m/z 339, # 5 linolenic acid m/z 335, #7 stearic acid m/z 341.

