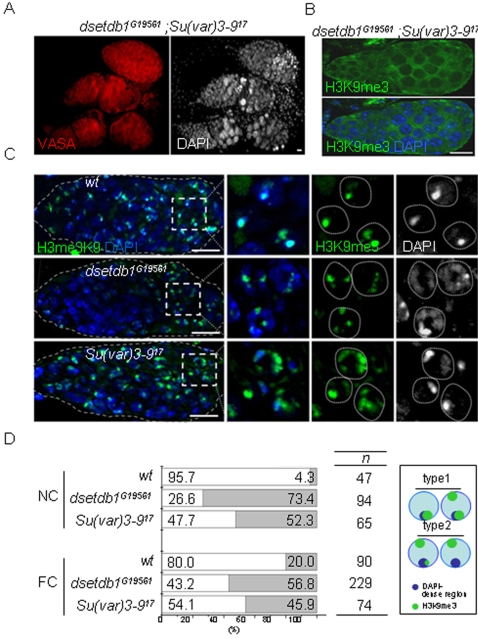
Figure 5. Disturbed trimethylated H3-K9 patterns in dsetdb1G19561 and Su(var)3–917 germaria.
(A) A dsetdb1G19561; Su(var)3–917 double mutant with gourd-shaped germaria. Note the VASA-positive cells accumulated in a mass in the posterior region of the germarium. (B) A dsetdb1G19561; Su(var)3–917 double mutant germarium lacked H3K9me3 signals. (C) H3K9me3 patterns in region-3 nurse cells of wild-type (upper panel), dsetdb1G19561 (middle panel), and Su(var)3–917 germaria (lower panel). Boxed areas are enlarged into individual channels. Dotted lines indicate boundaries of nurse cell nuclei. Scale bars, 10 µm. (D) Frequency (%) of type-1 (white) and type-2 (gray) H3K9me3 patterns in nurse-cell (NC) nuclei and pre-follicle-cell (FC) nuclei (see text for classification). ‘n’ indicates the number of cells counted in each group. The schematic in the box illustrates the features of type-1 and type-2 cells graphically.

