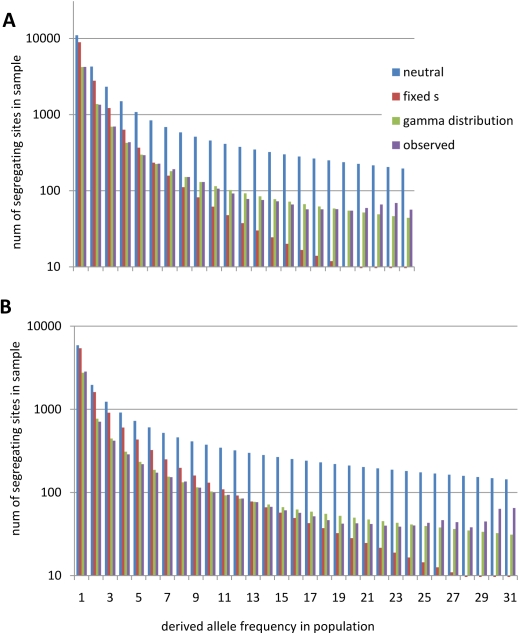
Figure 2. Observed and expected nonsynonymous site-frequency spectra after demographic correction.
Expected site-frequency spectra under best-fit selection models after demographic correction. Note the logarithmic scale of the y-axis. (A) African American replacement SNPs versus expectation under neutrality, fixed selective effects, and gamma distribution of fitness effects. (B) European American replacement SNPs versus expectation under neutrality, fixed selective effects, and gamma distribution of fitness effects.

