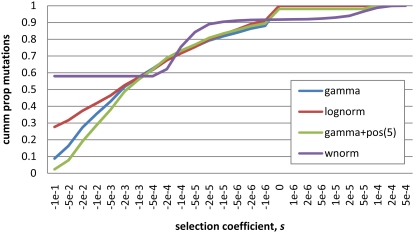
Figure 3. Cummulative proportion of nonsynonymous mutations with a selection coefficient less than s.
Gamma and lognormal curves represent the best-fit gamma and lognormal models to the African American polymorphism data (Table 1). Gamma+pos and wnorm are the best-fit gamma distribution with positive selection at 2Nes = 5 and best-fit weighted normal model to the African American polymorphism+divergence data. All four distributions predict nearly identical site-frequency spectra that closely match the observed data. Left side are deleterious selection coefficients; right side are advantageous selection coefficients.

