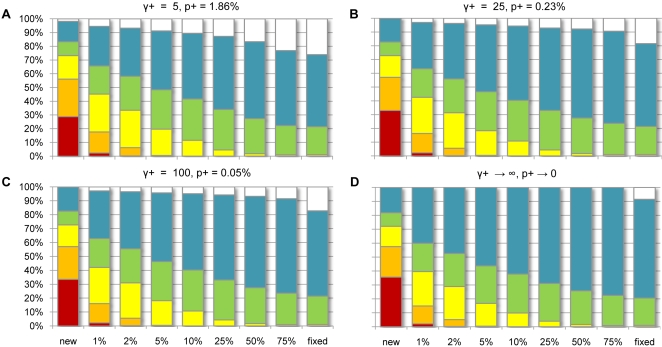
Figure 4. Inferred fitness effects of new, segregating, and fixed mutations in African-Americans.
Estimated proportion of new nonsynonymous mutations (left column), SNPs (middle columns), and human-chimp fixed differences (right column) which are strongly deleterious (s<−10−2; red), moderately deleterious (−10−2<s<−10−3; orange), weakly deleterious (−10−3<s<−10−4; yellow), nearly neutral (−10−4<s<−10−5; green), neutral (−10−5<s<0; blue), and positively selected (white) in a sample of 100 chromosomes from a population under the best-fit expansion model of African American demography. (A–C) Proportions estimated by assuming all positively selected mutations have an effect of (A) γ+ = 5, (B) γ+ = 25, (C) γ+ = 100 and finding the MLE of the resulting three-parameter selection model (gamma distribution of deleterious fitness effects and a proportion (p+) of sites positively selected) to the African American polymorphism and divergence data. (D) Proportions estimated from the best-fit gamma distribution selection model (Table 1) in African Americans (equivalent to assuming positive selection is strong enough that positively selected mutants are never observed in the site-frequency spectrum). The resulting MLEs are (A) α = 0.228, β = 3100, p+ = 0.0186; (B) α = 0.200, β = 5400, p+ = 0.0023; (C) α = 0.196, β = 5850, p+ = 0.0005; (D) α = 0.184, β = 8200, p+→0. Models (A–C) provided equally good fits to the polymorphism data, but they outperformed the best-fit gamma model and best-fit gamma+neutral model by 4.1, 3.5, 3.1 and 3.4, 2.8, and 2.4 LL units, respectively.

