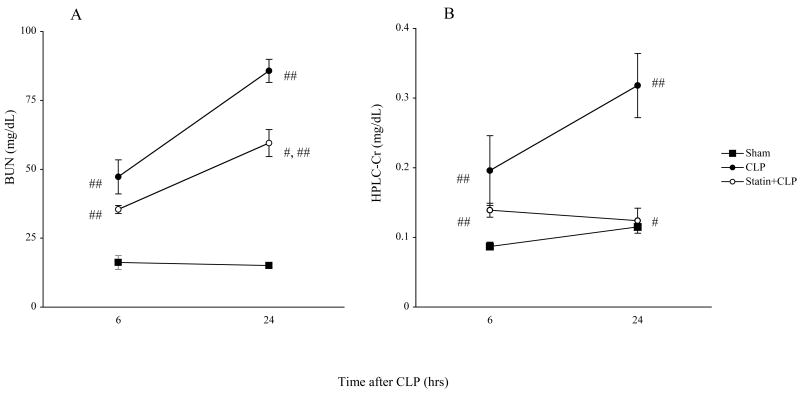
Figure 2. Effect of simvastatin on renal function following surgery.
Mice were treated as in Figure 1. Mice were sacrified at indicated times for measurement of serum BUN (A) and creatinine by HPLC method (B). Closed circles indicate CLP group. Open circles indicate Statin+CLP group. Closed squares indicate Sham group. Values are mean ± SE (N= 6∼16 per group). #, P < 0.05 vs. CLP. ##, P < 0.05 vs. Sham.

