
Figure 3. Effect of simvastatin on renal histology.
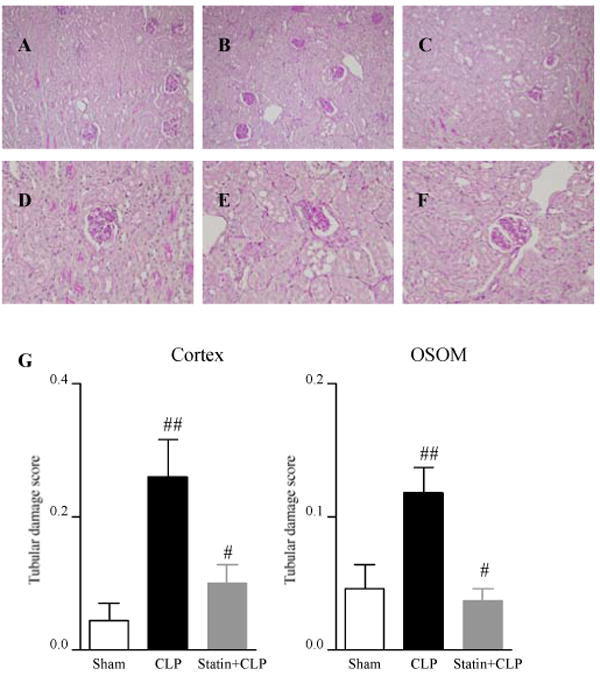
Mice were treated as in Figure 1. Mice were sacrified at 24 hrs after surgery. Histology of cortex in Sham group (A, D), CLP group (B, E), Statin+CLP group (C, F), Original magnification: X200 (A, B, C), X400 (D, E, F). (G) The tubular damage score (see Methods section) was measured in the cortex (left panel) and the outer stripe of the outer medulla (OSOM) (right panel). Values are mean ± SE (N=6∼16 per group). #, P < 0.05 vs. CLP. ##, P < 0.05 vs. Sham.