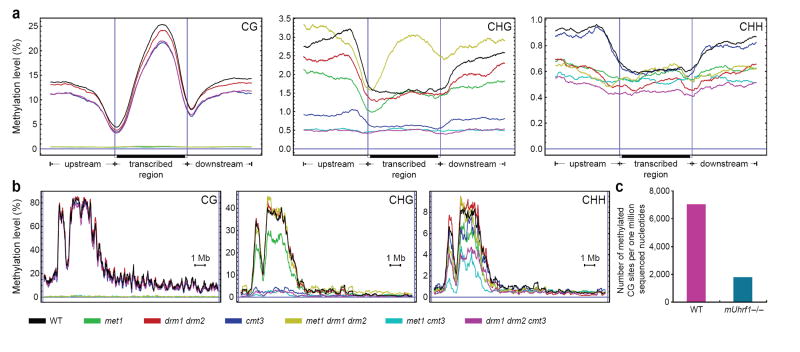
Figure 4. BS-Seq profiling of methylation mutants in Arabidopsis and mouse.
a, BS-Seq data mapping to protein-coding genes was plotted in 500 nucleotide sliding windows. Two vertical blue lines mark the boundaries between upstream regions and gene bodies (left) and between gene bodies and downstream regions (right). b, Distribution of methylation along chromosome 4 in 25 nucleotide sliding windows. In a and b, a horizontal blue line indicates zero percent methylation. c, Comparison of the amount of CG methylation in wild type and mUhrf1−/− embryonic stem cells, represented as the average number of CGs appearing per million sequenced nucleotides.

