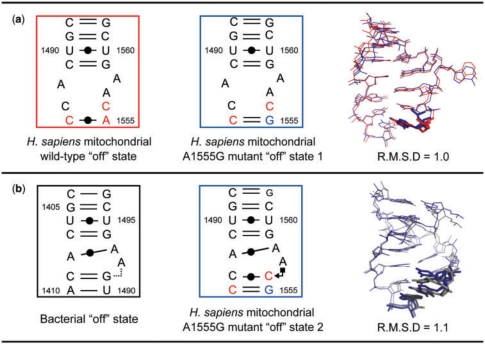
Figure 2.
Superimpositions between the ‘off’ state of the H. sapiens mitochondrial wild-type A site (red) and the first ‘off’ state of the A1555G mutant A site (blue) (a) and between the second ‘off’ state of the A1555G mutant A site (blue) and the ‘off’ state of the bacterial A site (gray) (b). The nucleotides different from those in each other are drawn in stick. In figures, geometric nomenclature and classification of nucleic acid base pairs are according to the Classification in (57).

