Figure 4.
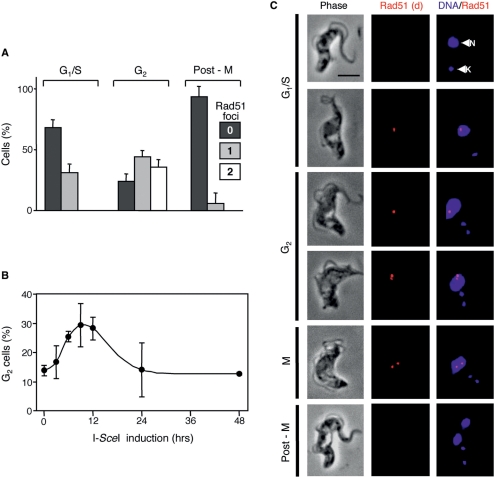
Rad51 foci and the G2M cell cycle checkpoint. Cells were processed for Rad51 immunofluorescence microscopy and DNA was counter-stained with DAPI. (A) The bar-chart shows the proportion of Sce2110 cells at different phases of the cell cycle with zero, one or two Rad51 foci 12 h after I-SceI-induction. Cell cycle phase was defined by the number of nuclei (N) and kinetoplasts (K) as determined by DAPI staining. n = 50 at each cell cycle phase. Error bars, SD. (B) G2M phase (1N2K) kinetics. The proportion of 1N2K cells was counted at different times after I-SceI-induction. n = 200 at each time point. Error bars, SD. (C) Immunofluorescence analysis of Rad51 in Sce2110 cells after I-SceI-induction. Rad51 signals are shown after deconvolution (d). N, nucleus; K, kinetoplast. Scale bar, 5 μm.

