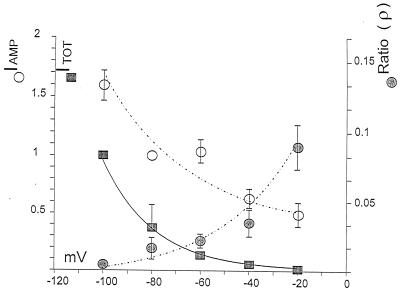
Figure 3.
The filled squares represent the average NE-induced current during 2-sec voltage steps (4 mM in the pipette, as in Fig. 1A). We define NE-induced current as the current during a protocol minus the unblocked current after adding 8–12 μM DS to the bath (n = 3). Data points and bars indicate average ± SEM. The open circles represent the average amperometric current during 2-sec voltage steps; we obtained these values by subtracting the average current at +60 mV from the current at each potential. To separate the two curves, we normalized the filled squares at −100 mV and the open circles at −80 mV. The filled circles are the ratio (ρ) of the average amperometric current to the DS-sensitive patch current. This ratio shows that the percentage of the current carried by NE increases with potential. By using z = 3 to convert IAMP into NE molecules, the oxidation products during the 2-sec pulse, at −20 mV, NE carries more than nearly 10% of the NE-induced current. Although uptake increases at negative voltages (open circles), ρ values decrease because more total charge is translocated.

